HI, I'M REKHA
I FACILITATE THE FULL UX/UI PROCESS

I am a user experience designer with over 10 years experience in creating web and mobile applications. I love to craft intuitive products with empathy, creativity and curiosity. I enjoy learning and understanding the nuances of human behavior and psychology. Design to me is a process of stepping into user's shoes, learning about their day-to-day challenges and solving all the complexity, so that I can give them a simple, intuitive and clean interface. I am UX Strategist and Designer with experience working at startups, multinationals in user experience, visual design, mobile design and front end development roles.
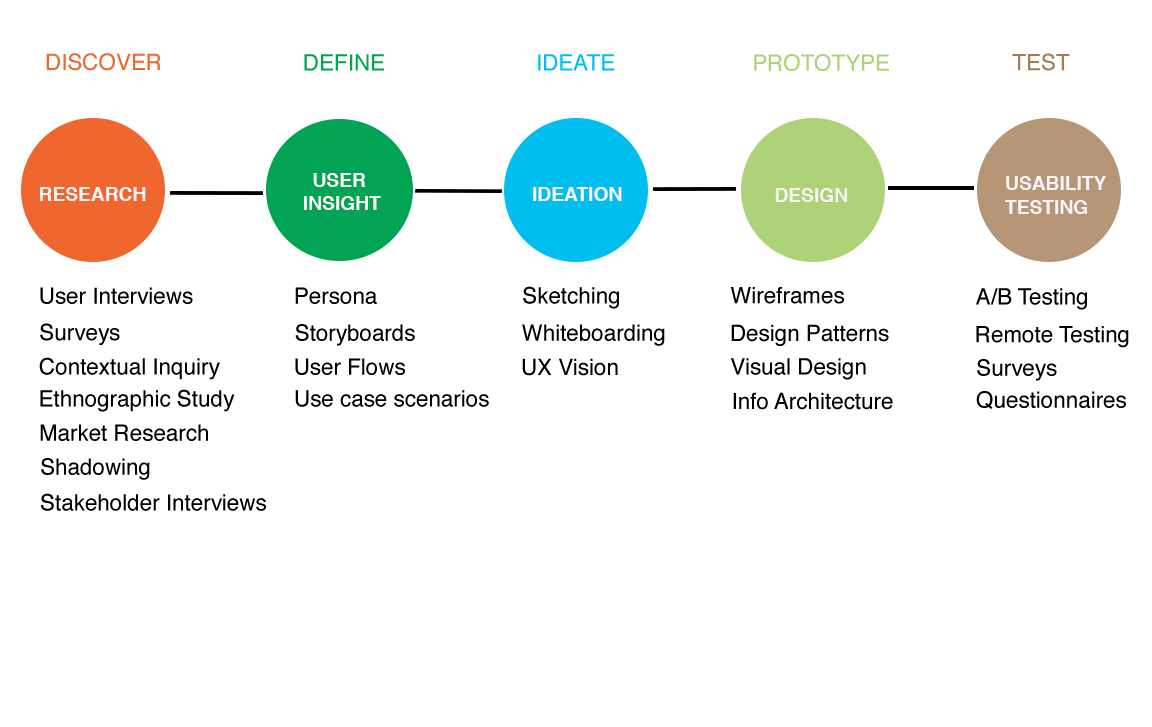
My education in Human Computer Interaction (M.S) and Computer Engineering (B.S.) equips me with an array of Software, Web and UX Design skills. The amalgamation of my technical skills, design skills and passion for creativity and human psychology equip me with all the tools to solve complex problems and turn them into sleek, clean and usable solutions. My UX Design skill set spans web design, user research, rapid prototyping, hi and low fidelity wireframes, story boarding, prototyping, usability testing, competitive analysis, stakeholder interviews and branding, and front end development.
Core skills:
Core Values:
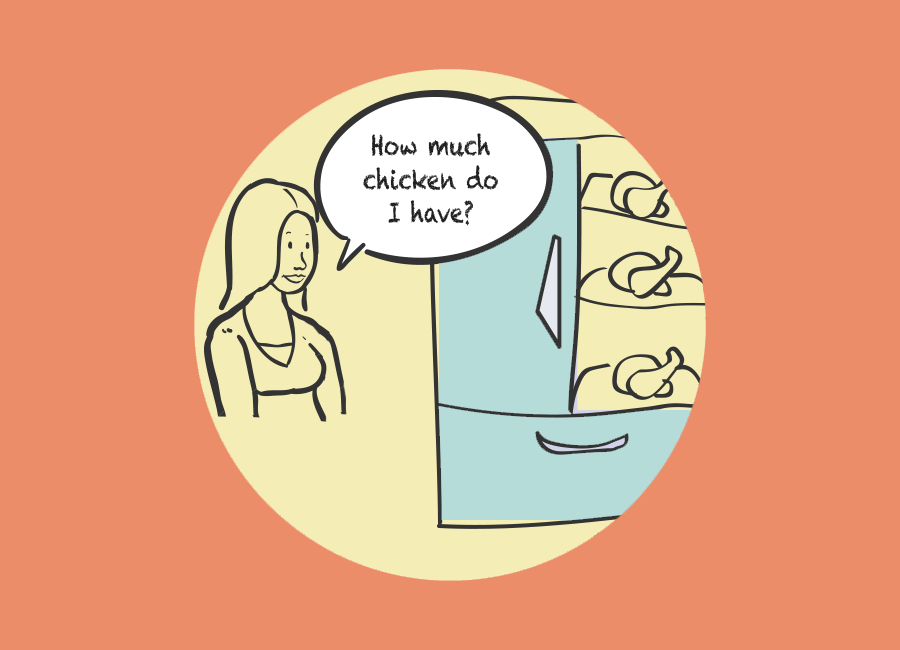
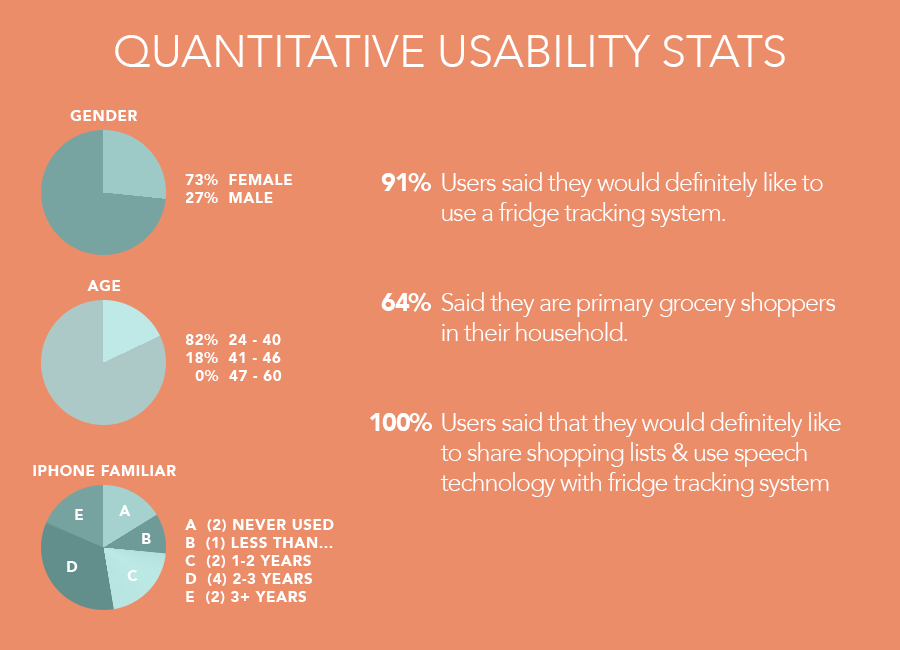
Fridge inventory management has traditionally been done manually with no help from modern technology such as software applications. As a result, we face the same issues as the generation that first introduced the fridge as an everyday appliance. It is hard to remember what items are stored in the fridge and when they are going to expire. It is hard to remember the quantity of the stored items in Fridge. It is hard to remember what items are missing and need to be be purchased. It is hard to sync on shopping needs with other family members.
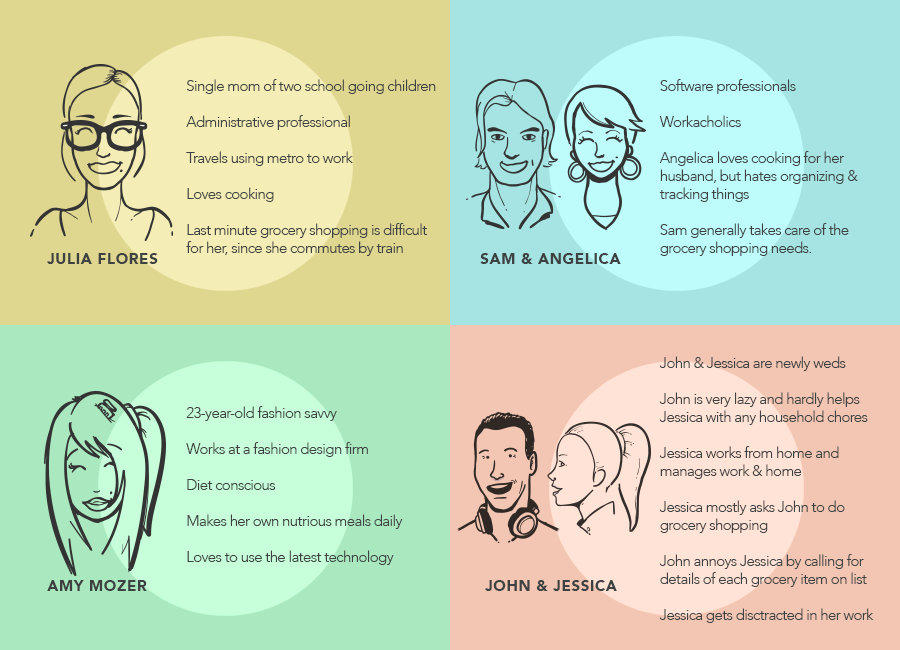
We started by designing different personas who would need automated fridge inventory management. We came up with 4 different personas with different needs. The challenge was to design a solution which meets the needs of all the personas. We created storyboards of problem scenarios and solution scenarios. We came up with an iPhone app, which will help users manage their fridge inventory. We named it Fridge Assist as it helps manage fridge inventory on the go.
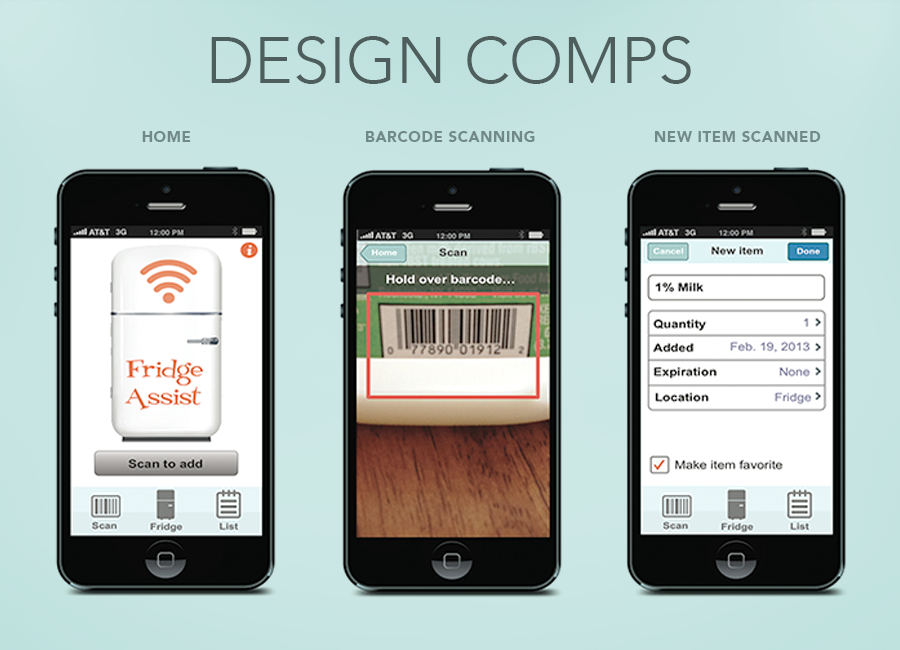
We created the fridge assist prototype using Axure and Illustrator. We developed the information architecture flow and high fidelity comps. We used the Siri speech technology to assist personas who want to manage their fridge inventory while driving. We use scan technology for scanning and storing the fridge items on the app. We used icloud technology for sharing the shopping list and fridge inventory between multiple people in house.
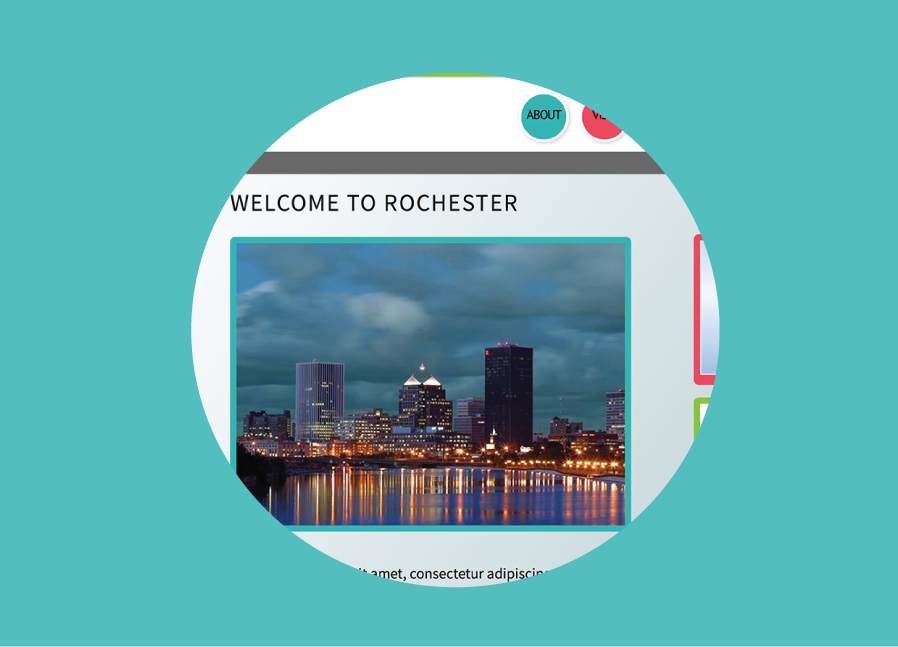
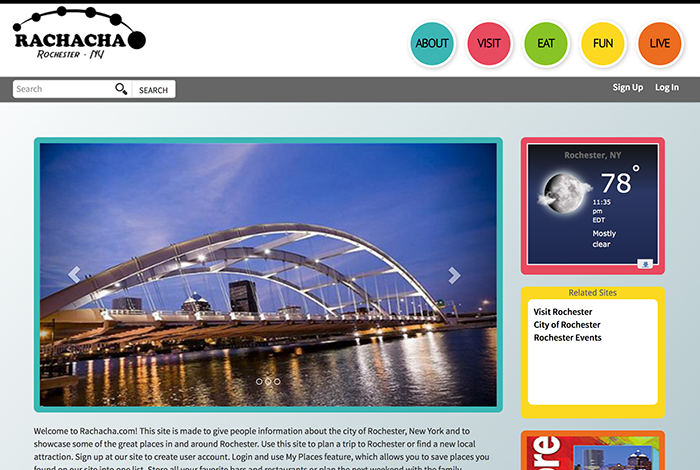
The project goal was to redesign the existing rachacha website. The existing rachacha website was hard to maintain and needed expert web skills for updating the pages. We started by doing competitive analysis of existing rochester websites. We decided to create a website which would provide information to local residents, visitors, students and employees about weather, history, government, transportation, fun activities, restaurants and bars in and around Rochester. We decided to also provide information about school systems, housing, higher education, economy and jobs to people who decide to live in Rochester.
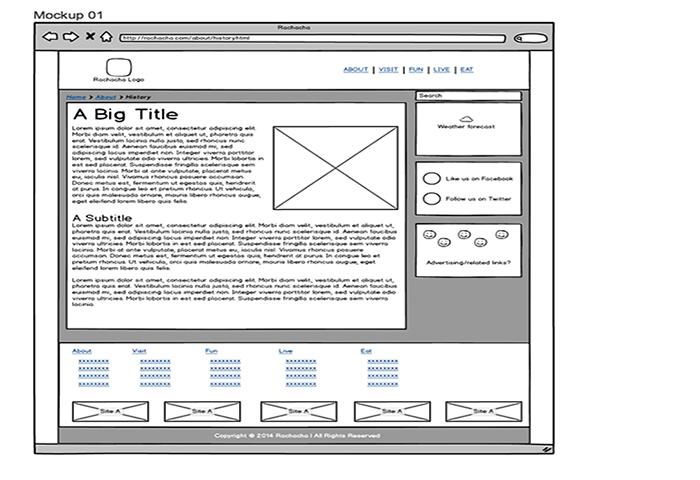
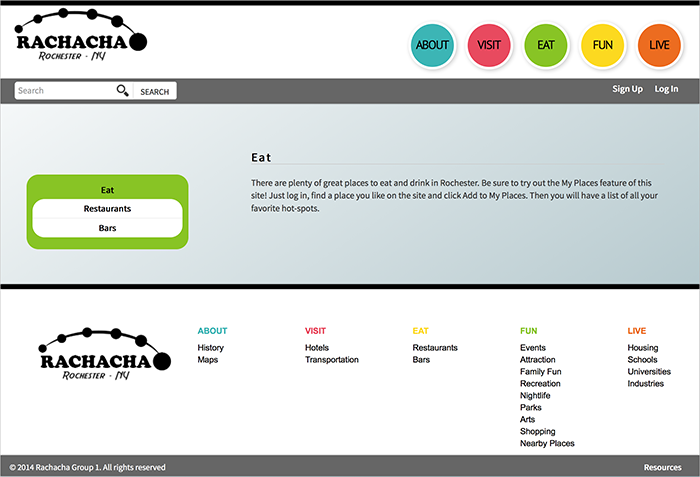
We started by designing different personas who would use Rachacha website. The challenge was to design a solution which is easy to maintain and does not require expert web technology skills. Our team brainstormed and came up with global and local navigation of website such that it is easy for users to navigate and get the required information. We designed various mockups for the Rachacha website. We came up with design prototype based on typography and CRAP design principles.
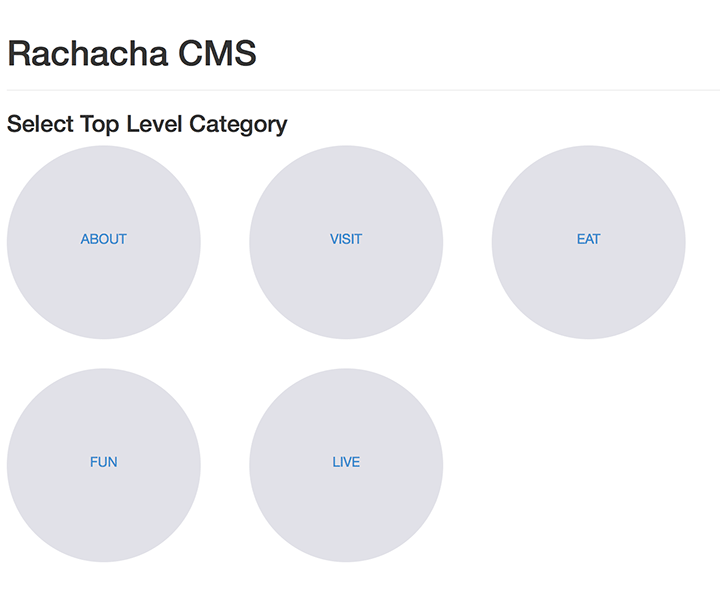
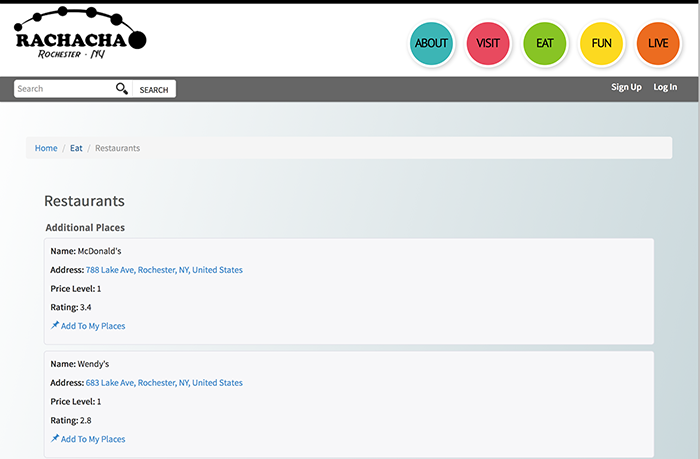
We came up with CMS based solution where the content of each page can be updated by CMS which is linked to database using PHP. We designed 3 main pages of websites and all the other pages were dynamically created using the the information from database. We used bootstap for designing a responsive website which will work on mobile devices.

The problems of blended learning are multifold.
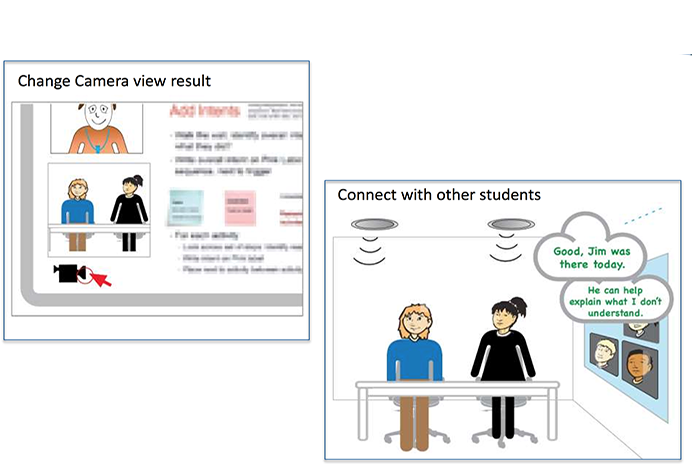
- How to ensure personal connection and interaction between online students, on-campus students and Professor?
- How to ensure that all the infrastructure needs of blended classroom are met?
- How to ensure that lecture time is effectively used?
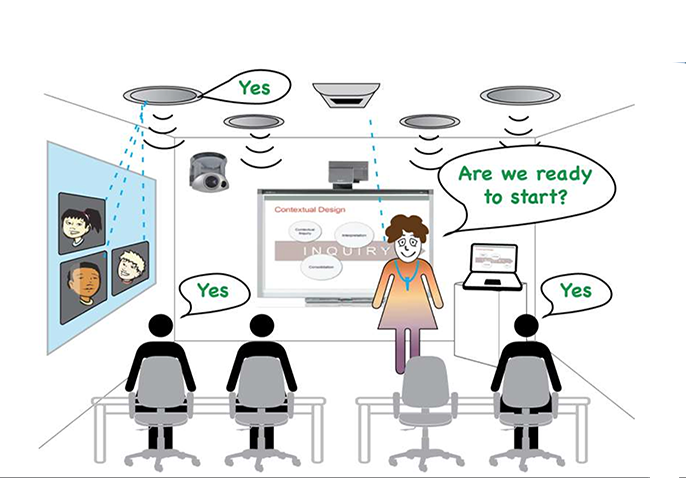
- How to ensure that the lecture is transmitted live to the online students effectively?
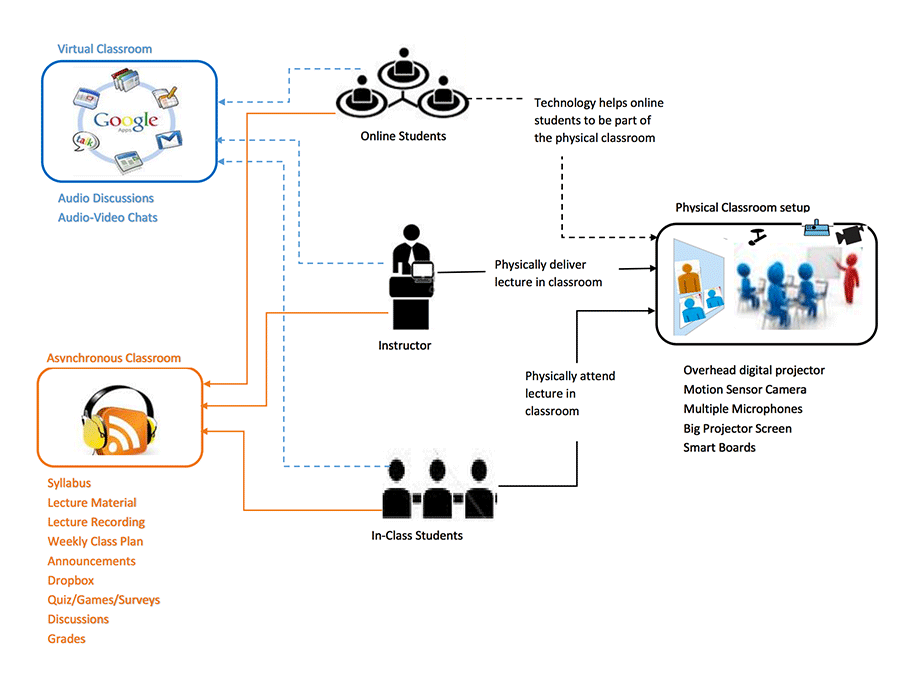
We used visioning to arrive to our solution for blended learning. Visioning and Storyboarding helped us design the solution meeting the needs of Professor, Online Students and On-Campus Students.
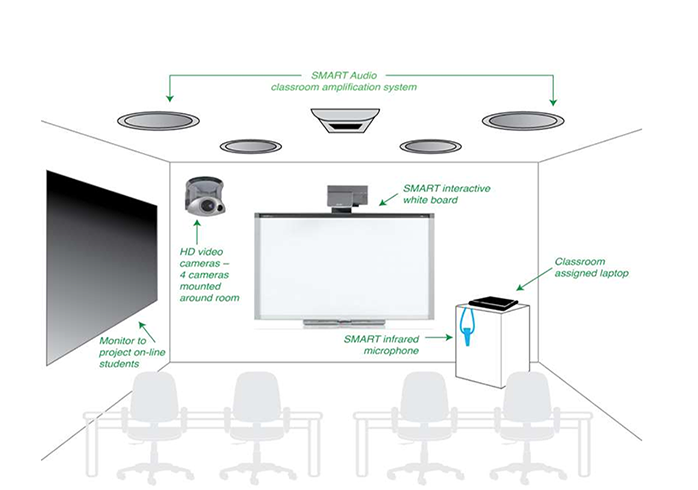
The challenge was to conduct contextual inquiry interviews with Professors, Online Students and On-campus Students.The purpose of contextual inquiry (CI) is to obtain data from users in their work place. We conducted 9 interviews to gain insights about the users’ environment, tasks, cultural influences and breakdowns in the current processes. We conducted Rapid Prototyping including affinity diagramming, consolidated sequence model, storyboarding and use case scenario design to the solve the blended spaces problem. We collected 154 individual notes for Affinity Diagram. A common theme in the Blended learning environment for all stakeholders was around the desire to communicate more effectively and the difficulties in communicating effectively with the current system between student and professor and student-to-student.
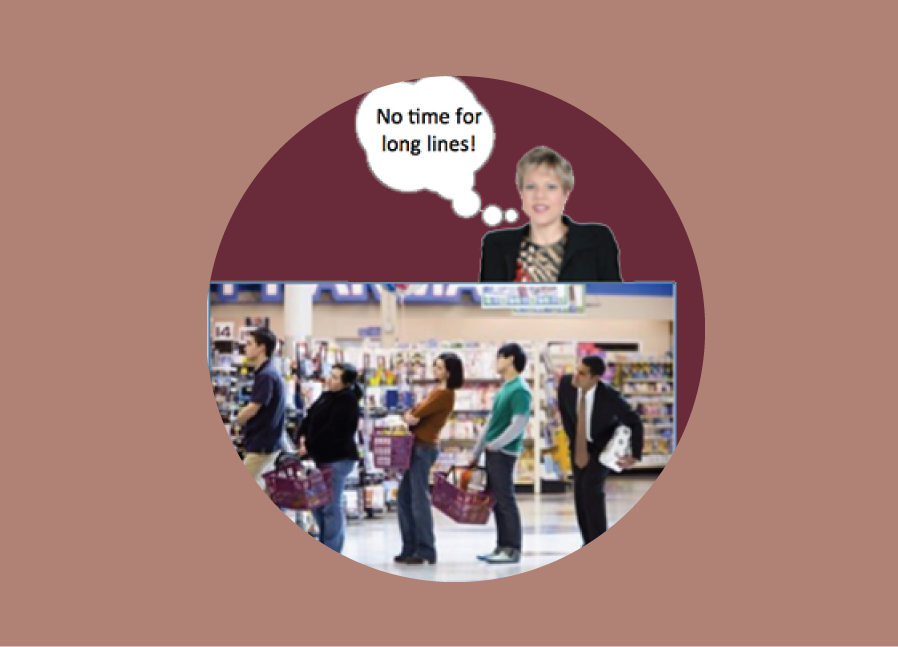
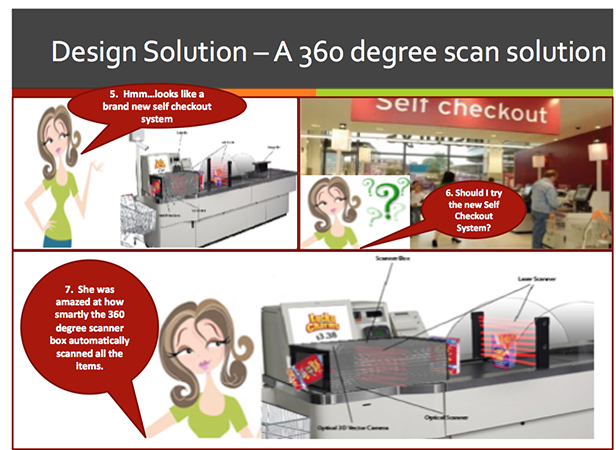
The welcome of self-checkout stations to local grocery stores has been a debatable topic. Our team has been committed to find the apprehension associated with self-checkout systems and bring possible solutions to the table.
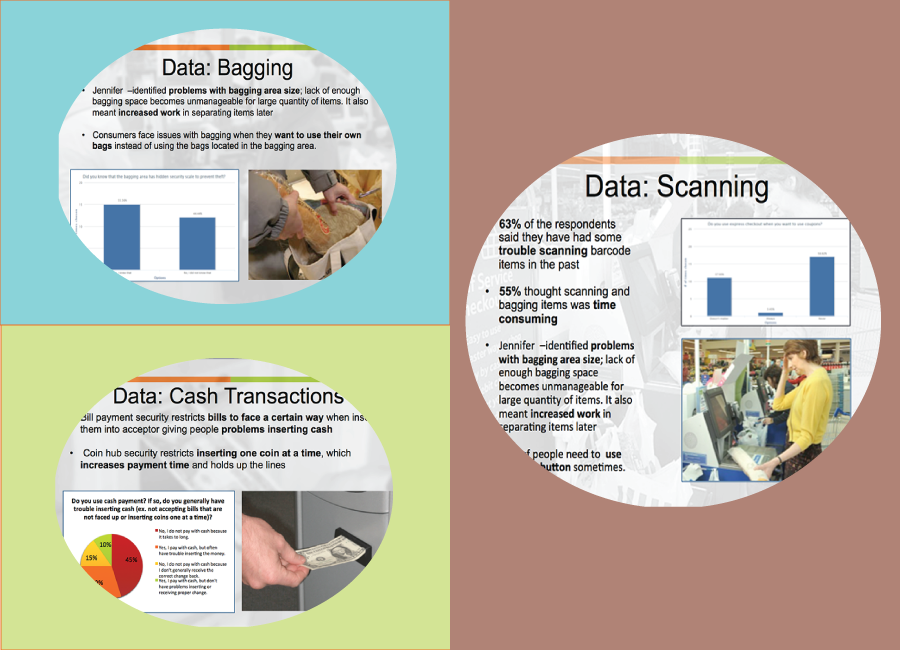
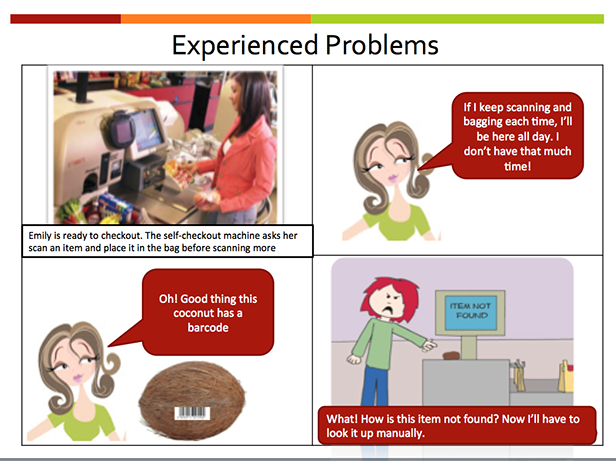
Our challenge was geographic locations of each of team members. We all were located in different location in United States. We decided to leverage that to gather diverse data. We used a range of data collecting methods such as contextual inquiry, shadowing, interviews, and questionnaires. We found that scanning, bagging, couponing, cash transactions and accessibility of the system were the major problem areas.
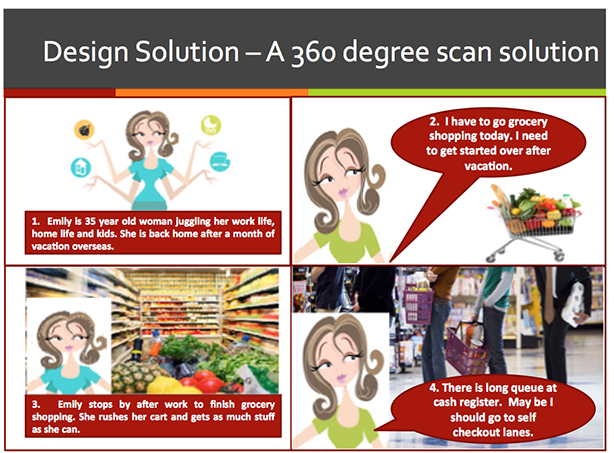
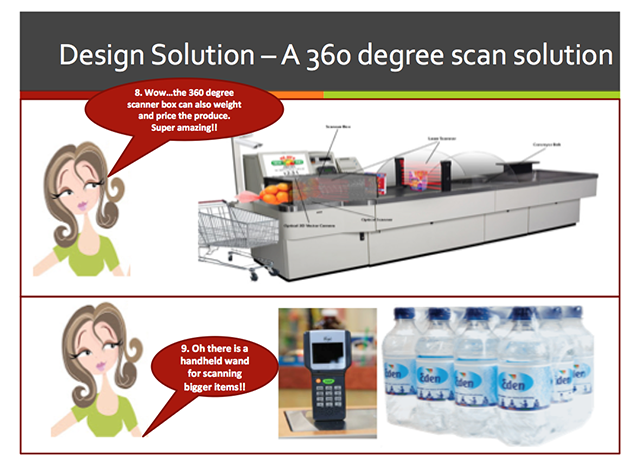
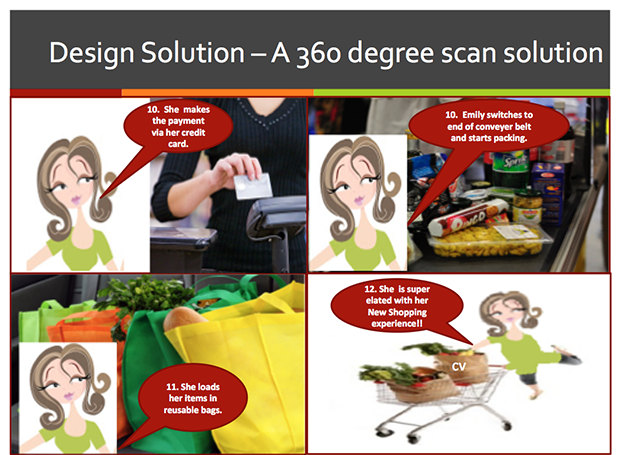
We came up with 360 degree scan solution to improve the overall self-checkout shopping experience. By integrating the self-checkout scanner box, the users will experience much faster processing time. It will require less input from the shopper and customer service, hence making it easier for the user and hopefully providing a more content experience.
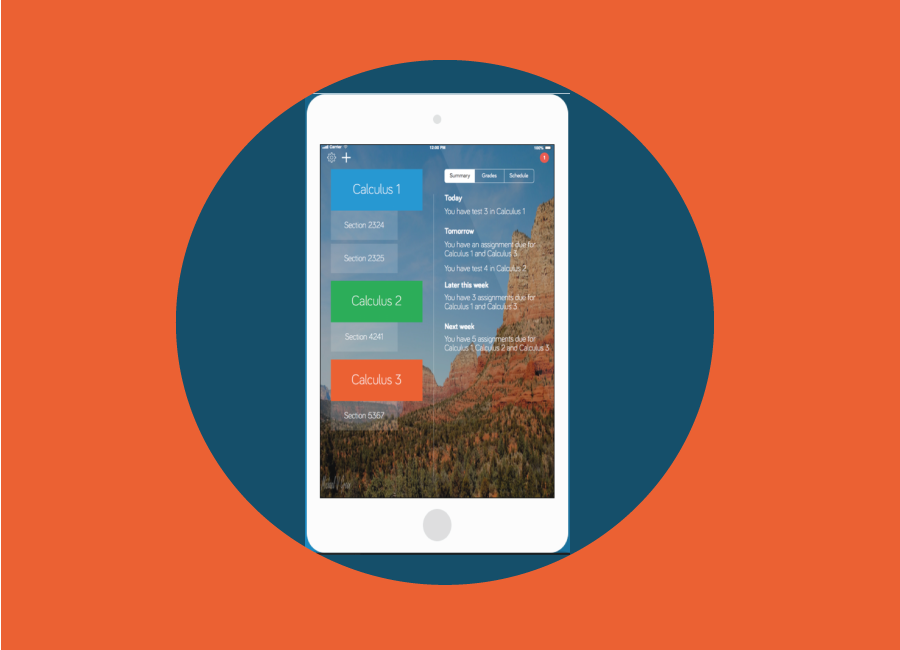
Skyvo has designed an educational app called Binder, which is K-12 iPad app to aid the students and teachers in the 1:1 iPad program. Binder has many uses and in this usability study we focused on Binder's test taking system.
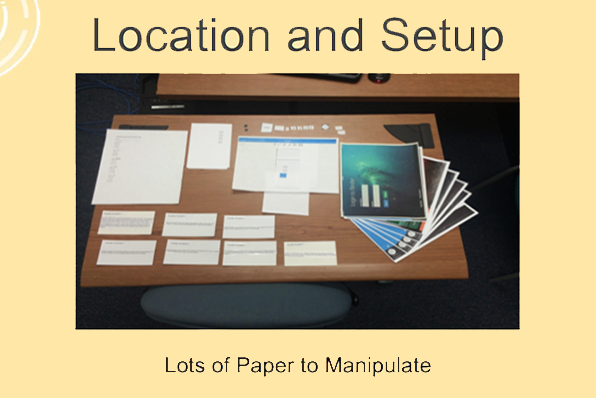
The challenge of this usability evaluation was to conduct the study using paper prototype. We had lots of paper to manipulate and design the study. Our study's goal was to answer these questions:
- How quickly and easily can users turn a paper test into a Binder test?
- How quickly and easily can users grade a Binder test?
- How quickly and easily can users answer test questions, use scrap paper, and submit the test?
- How do users feel about the Binder app?
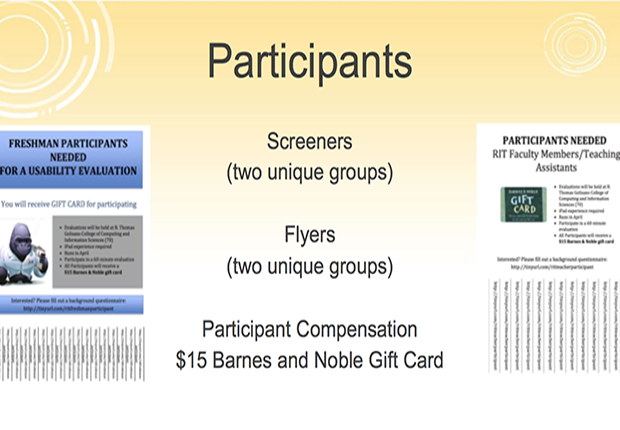
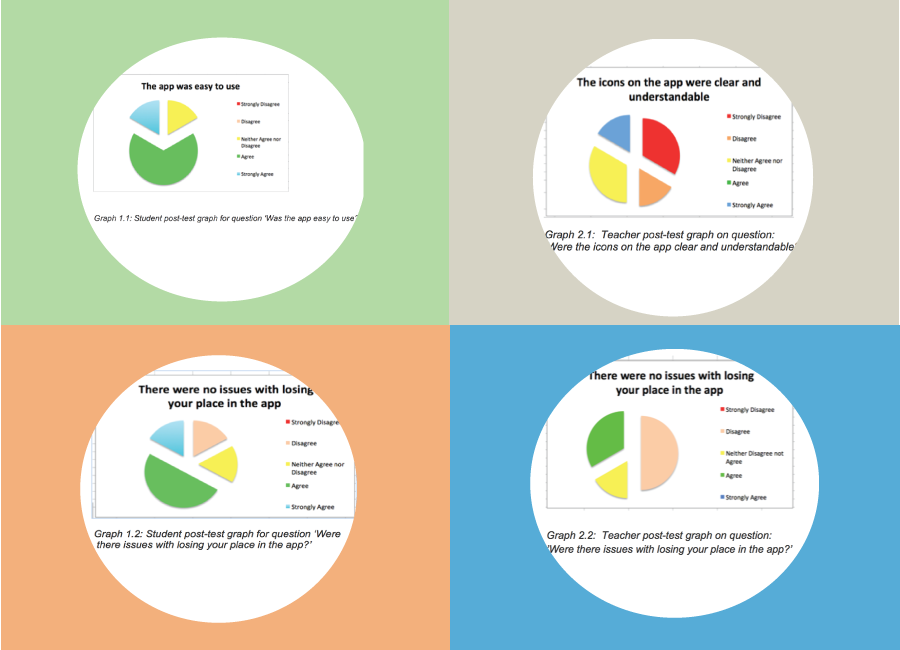
We conducted Heuristic evaluation for Skyvo's Binder iPad App and found usability issues. We then designed flyers, screeners and recruited participants. We conducted usability evaluation for 12 participants using Morae Manager. We audio-video recorded the test sessions and made highlight videos to portray the usability issues as depicted by the users. We performed statistical analysis of data and presented the findings to the client. Our team's findings contributed significantly to improve the final design of the product.
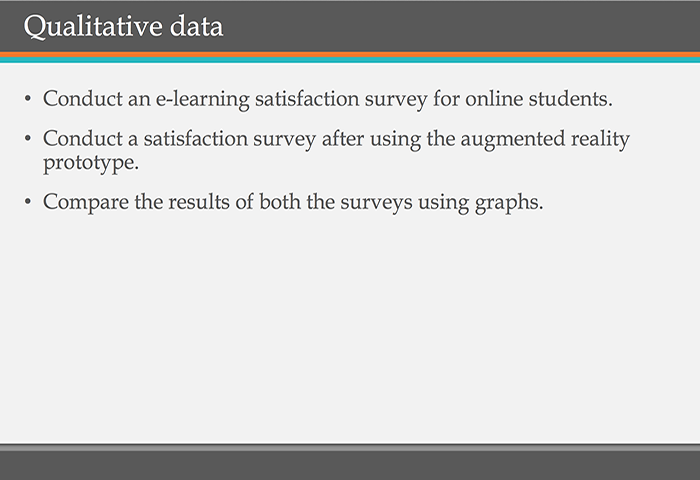
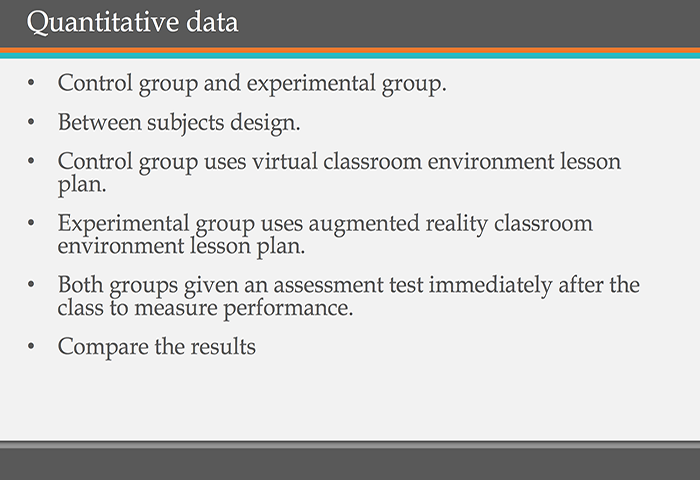
Augmented reality is the latest paradigm in computer technology. Augmented reality is essentially a computer-generated image super-imposed over the real-time-environment. There are lot of games based on the concept of augmented reality. Augmented reality has application in medical, education, construction, interior design, sports, navigation and gaming fields. The goal was to study and evaluate how augmented reality can help enhance the quality of education in field of online learning.
 \
\
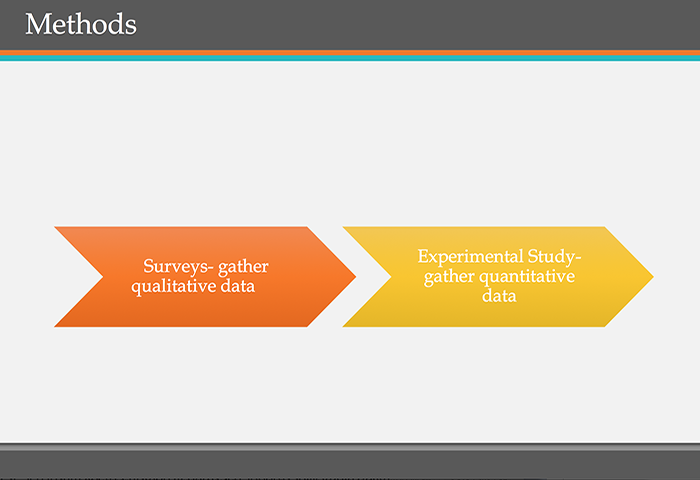
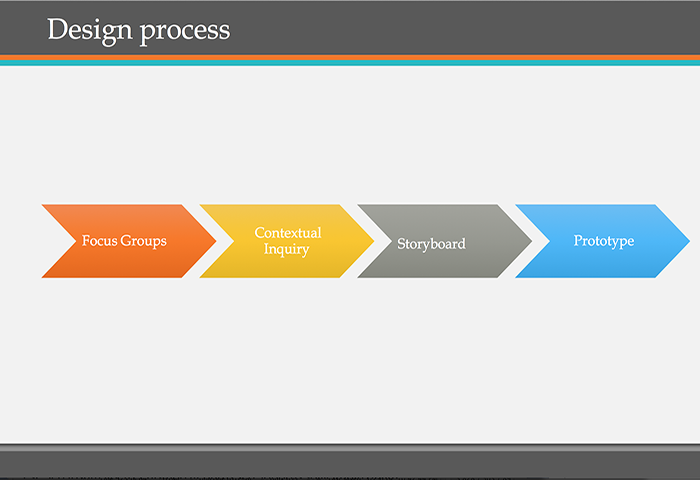
The challenge here was to come up with the design process which would portray the benefits of augmented learning in online learning space.
The solution I came up with was to superimpose the images of online learners in 3D form over the real-time image of the classroom. The gestures and facial expression of the online learner would also be captured using the 3D image. This combined image would be transmitted to every online learner's computer, thus creating an illusion for online learner that he/she is actually sitting in the classroom and attending the lecture. With the use of latest devices like google glass and other emerging technologies, it should be possible to make this magic in field of learning. I wrote a research paper based on literature review of augmented reality and online learning as part of this assignment.
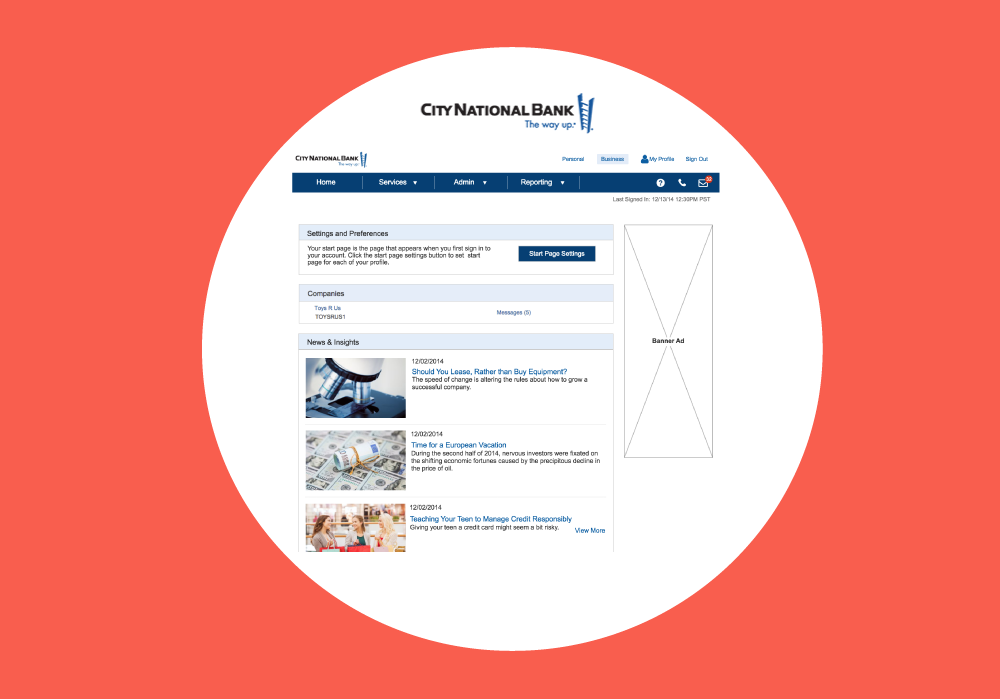
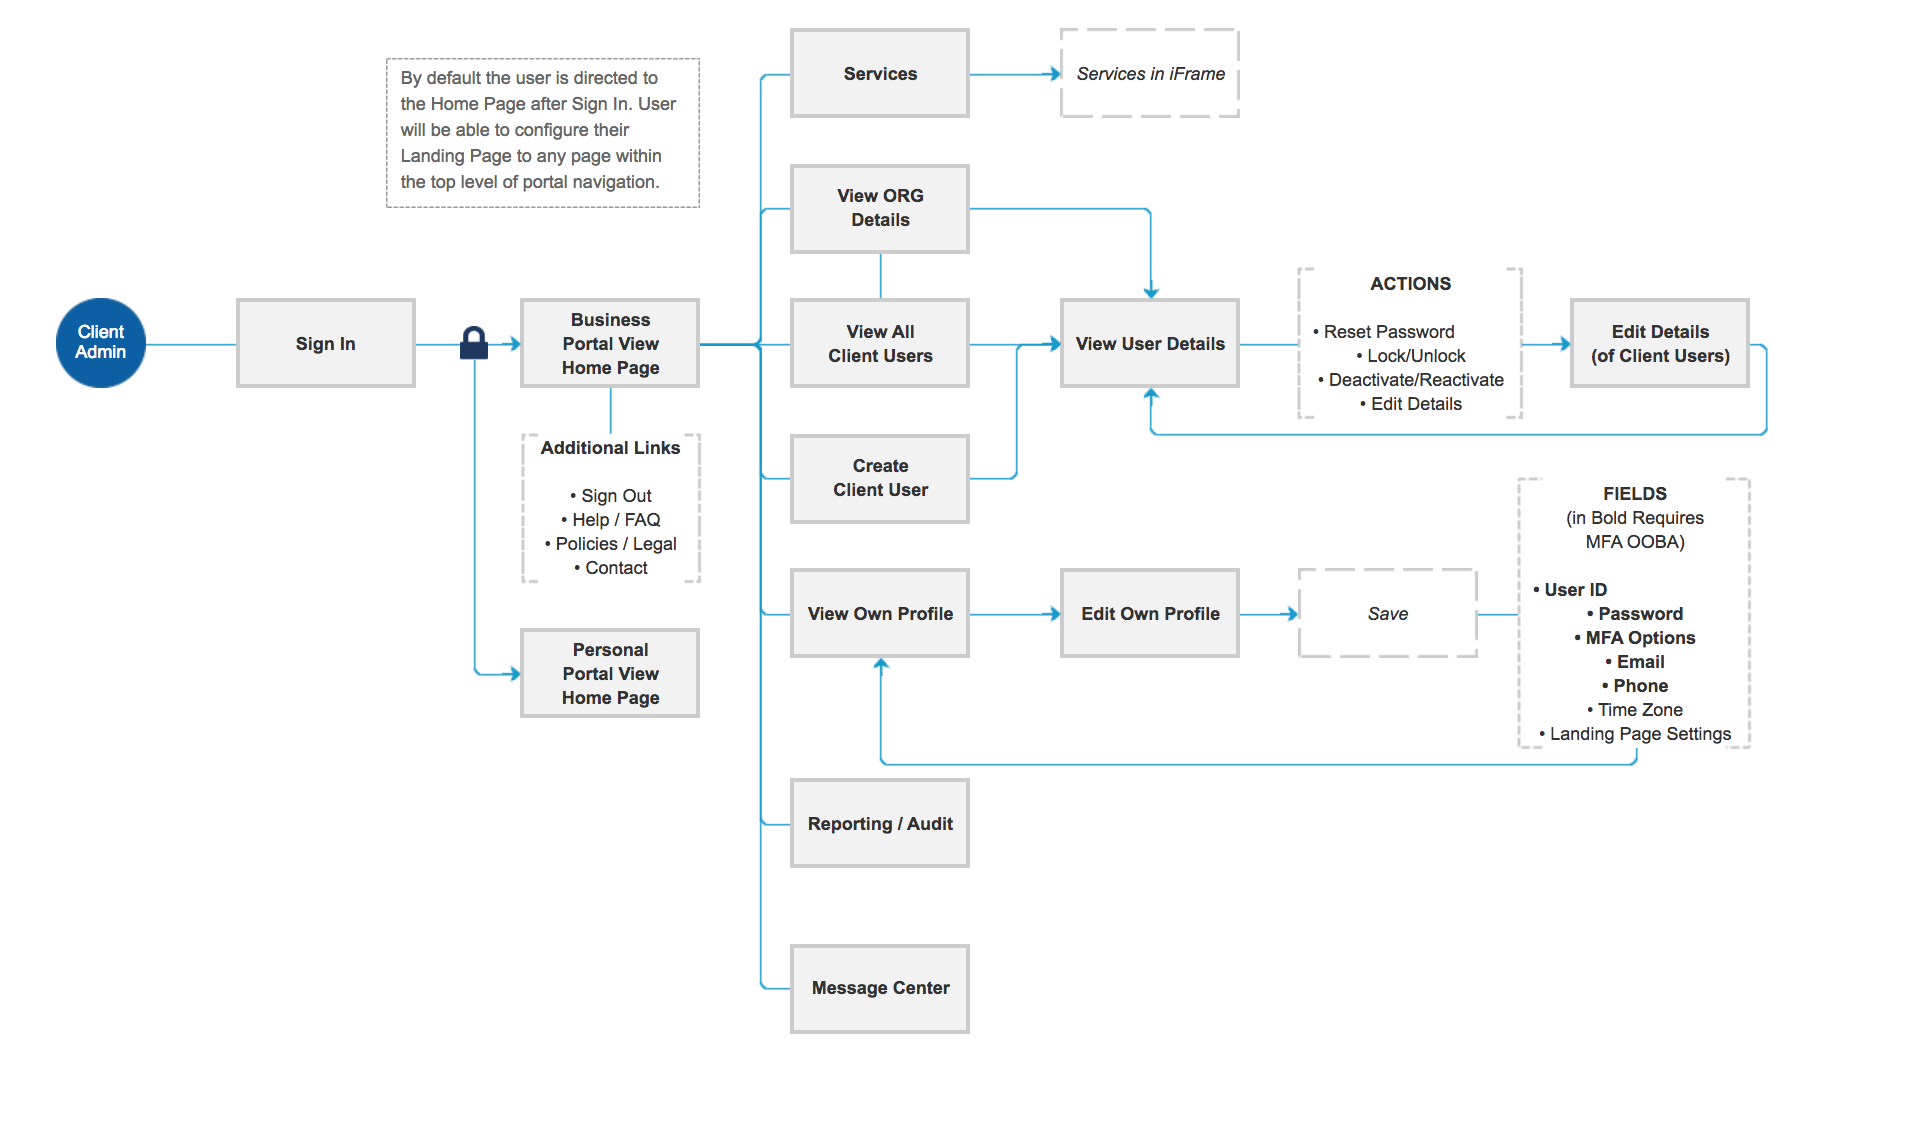
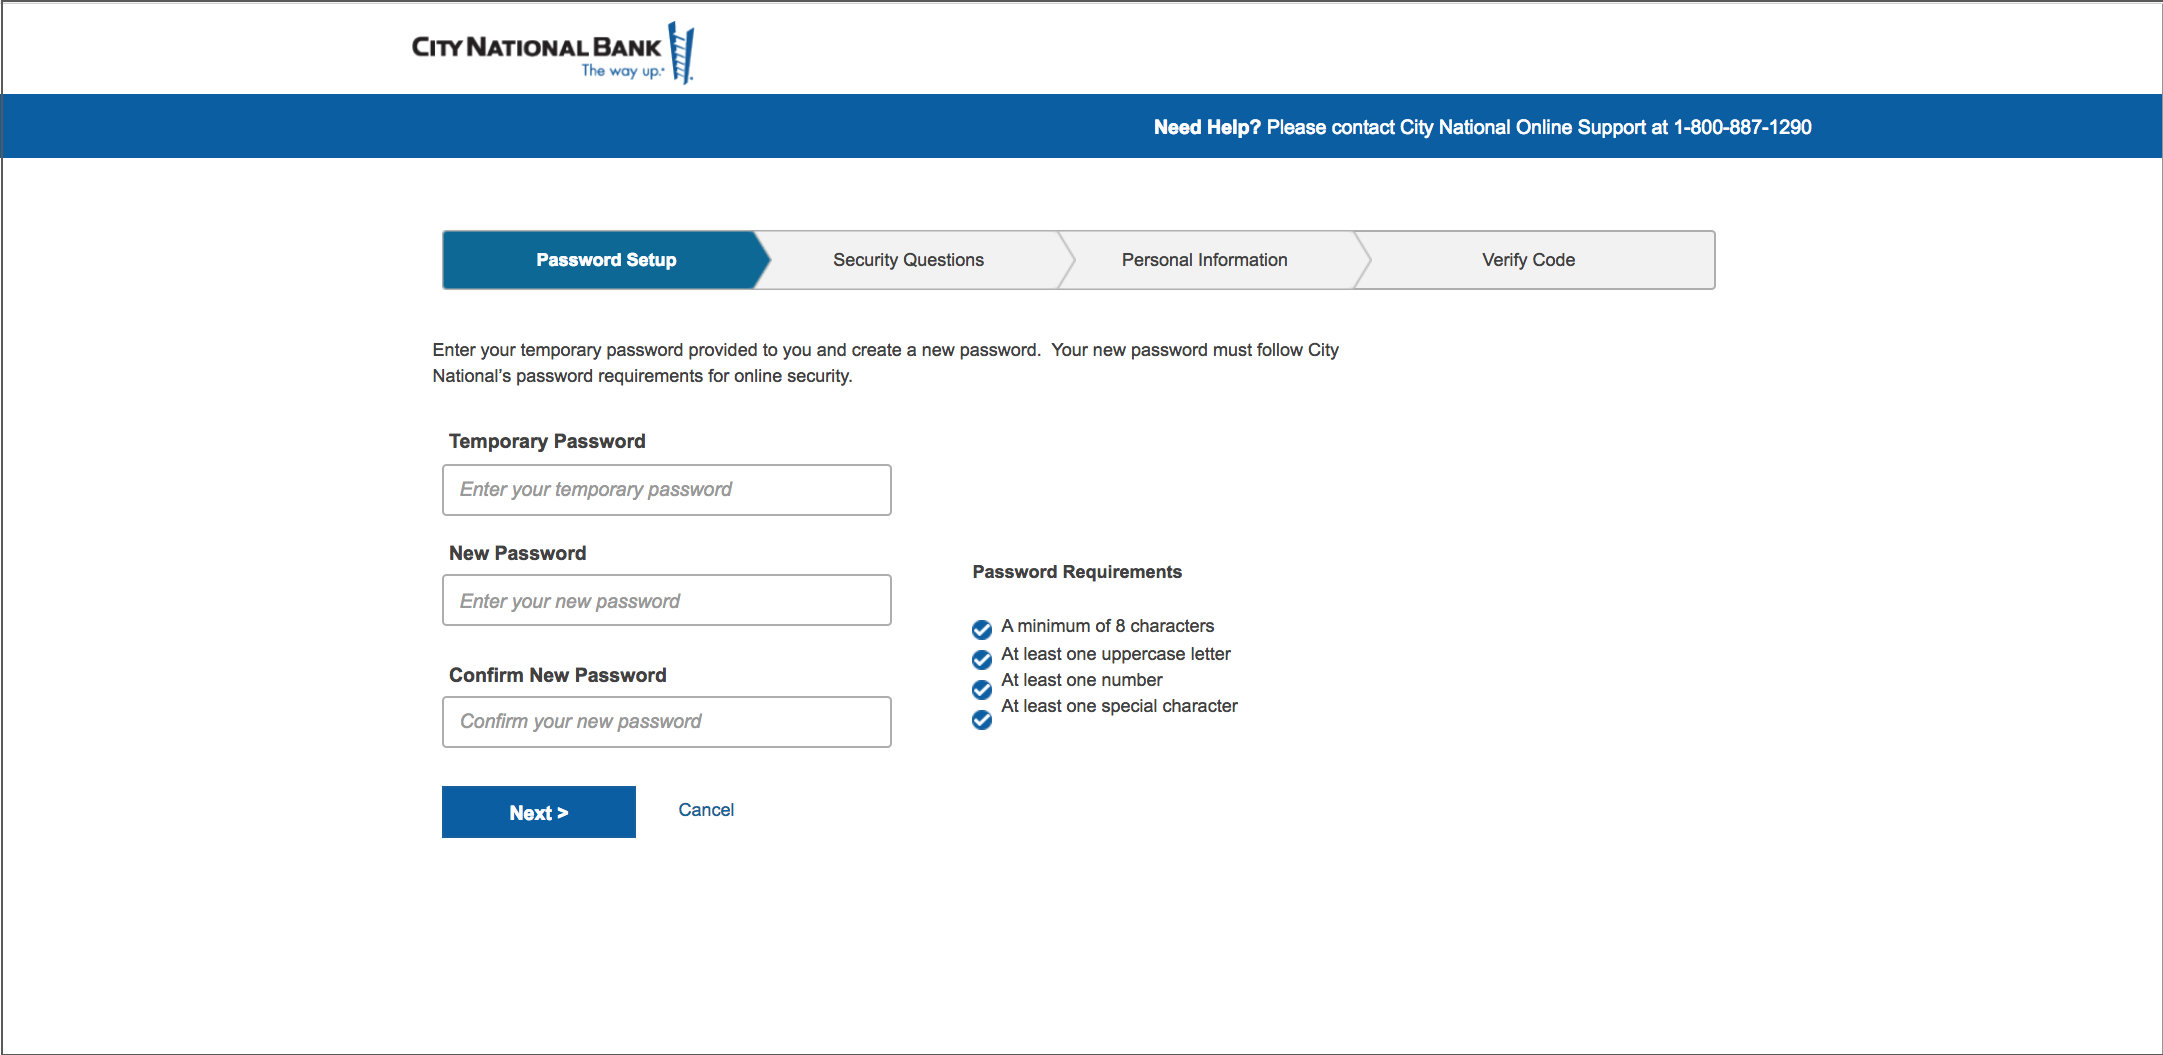
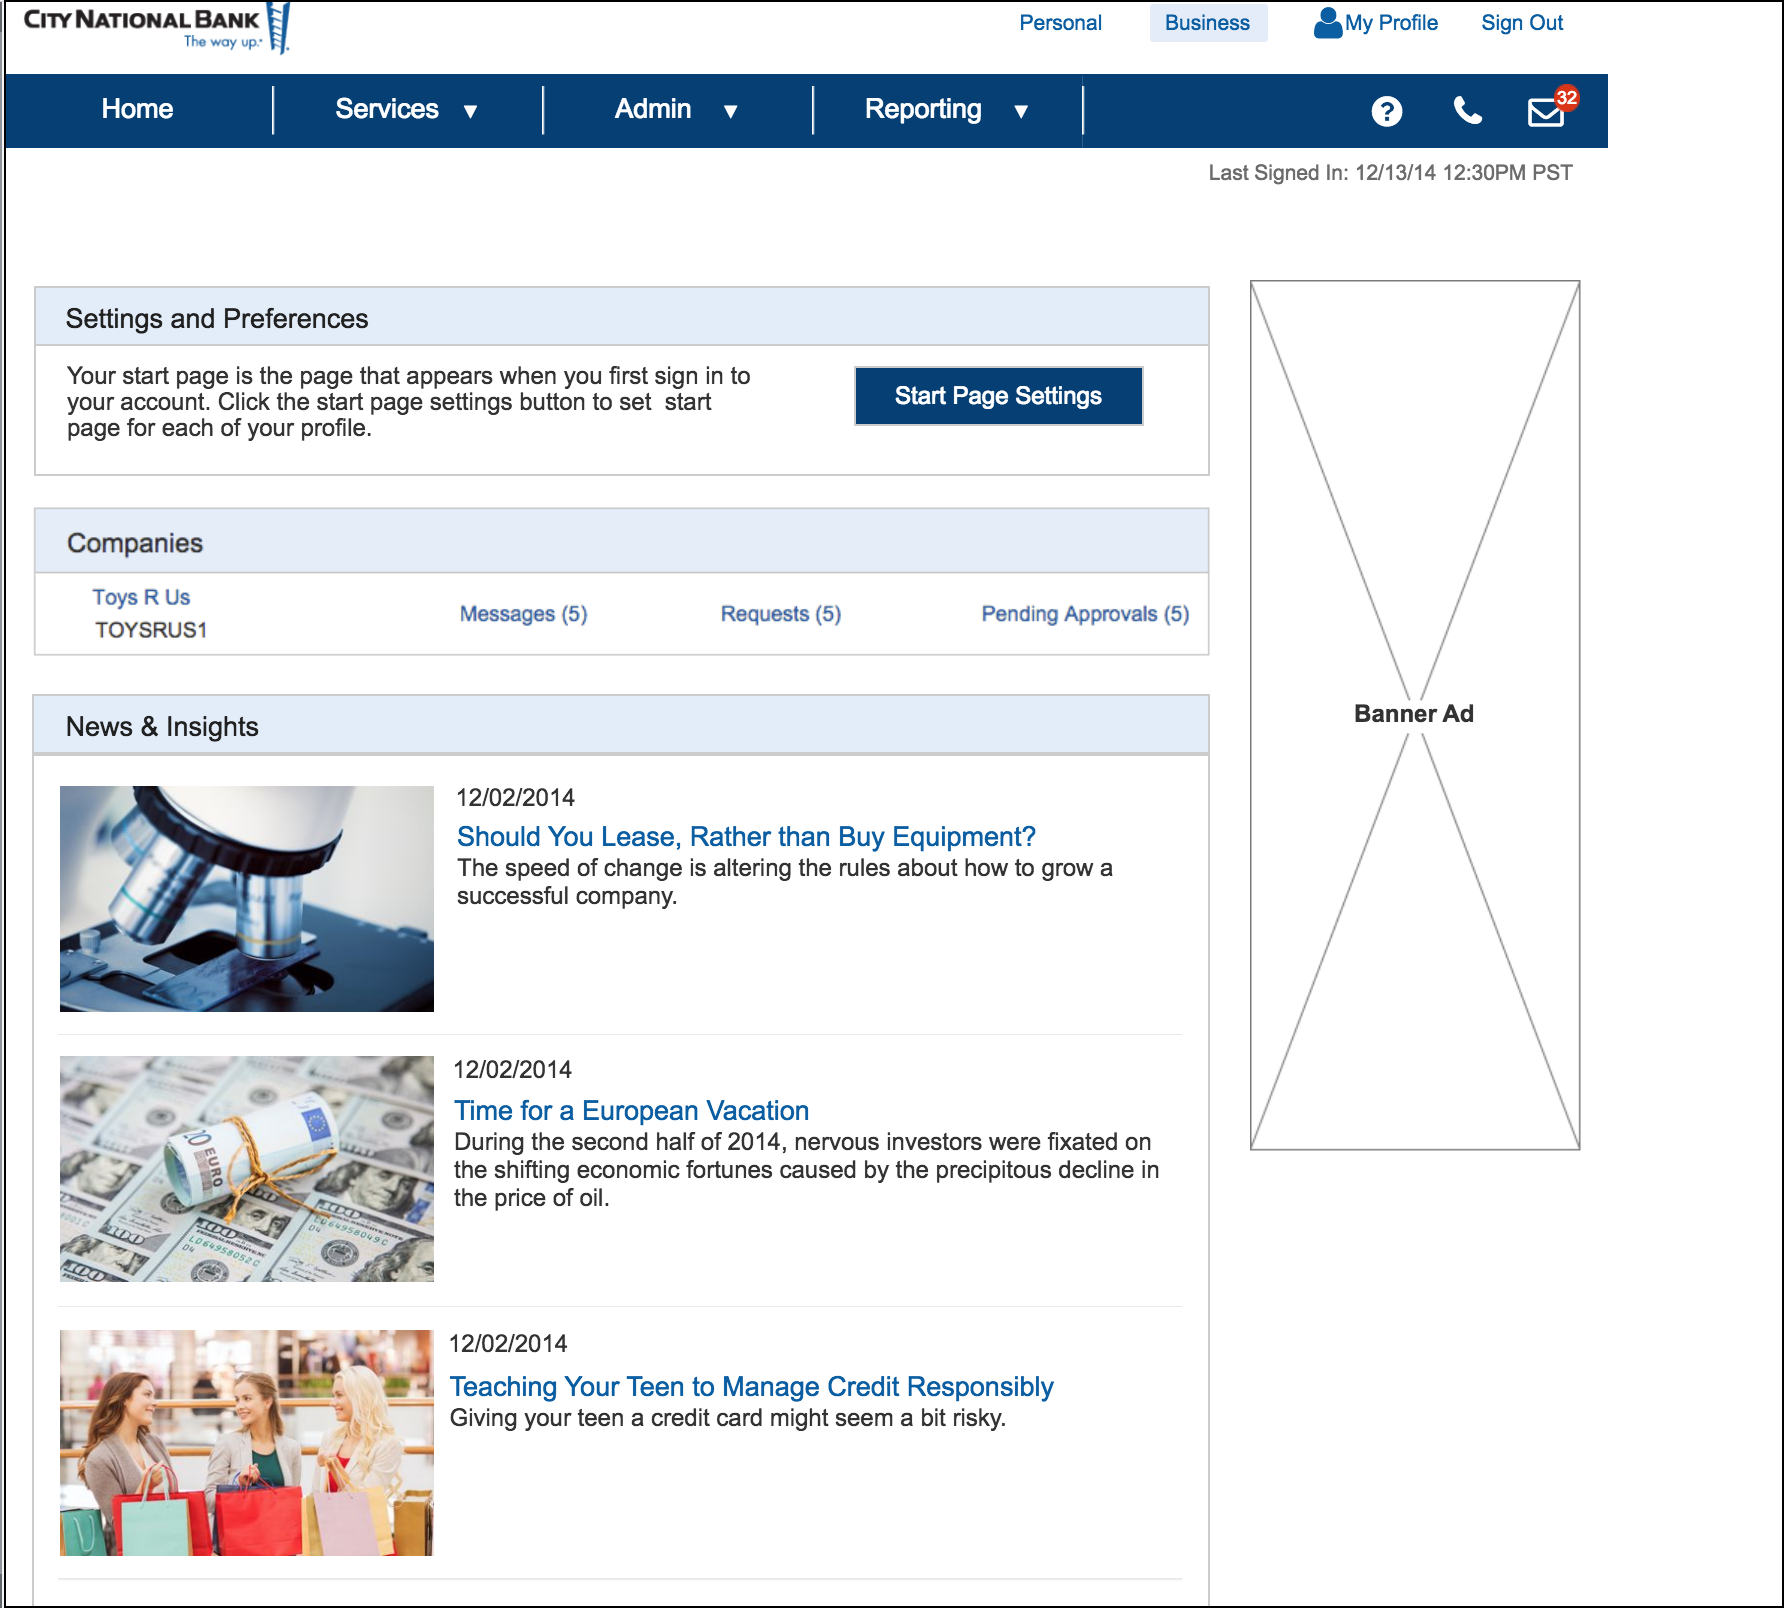
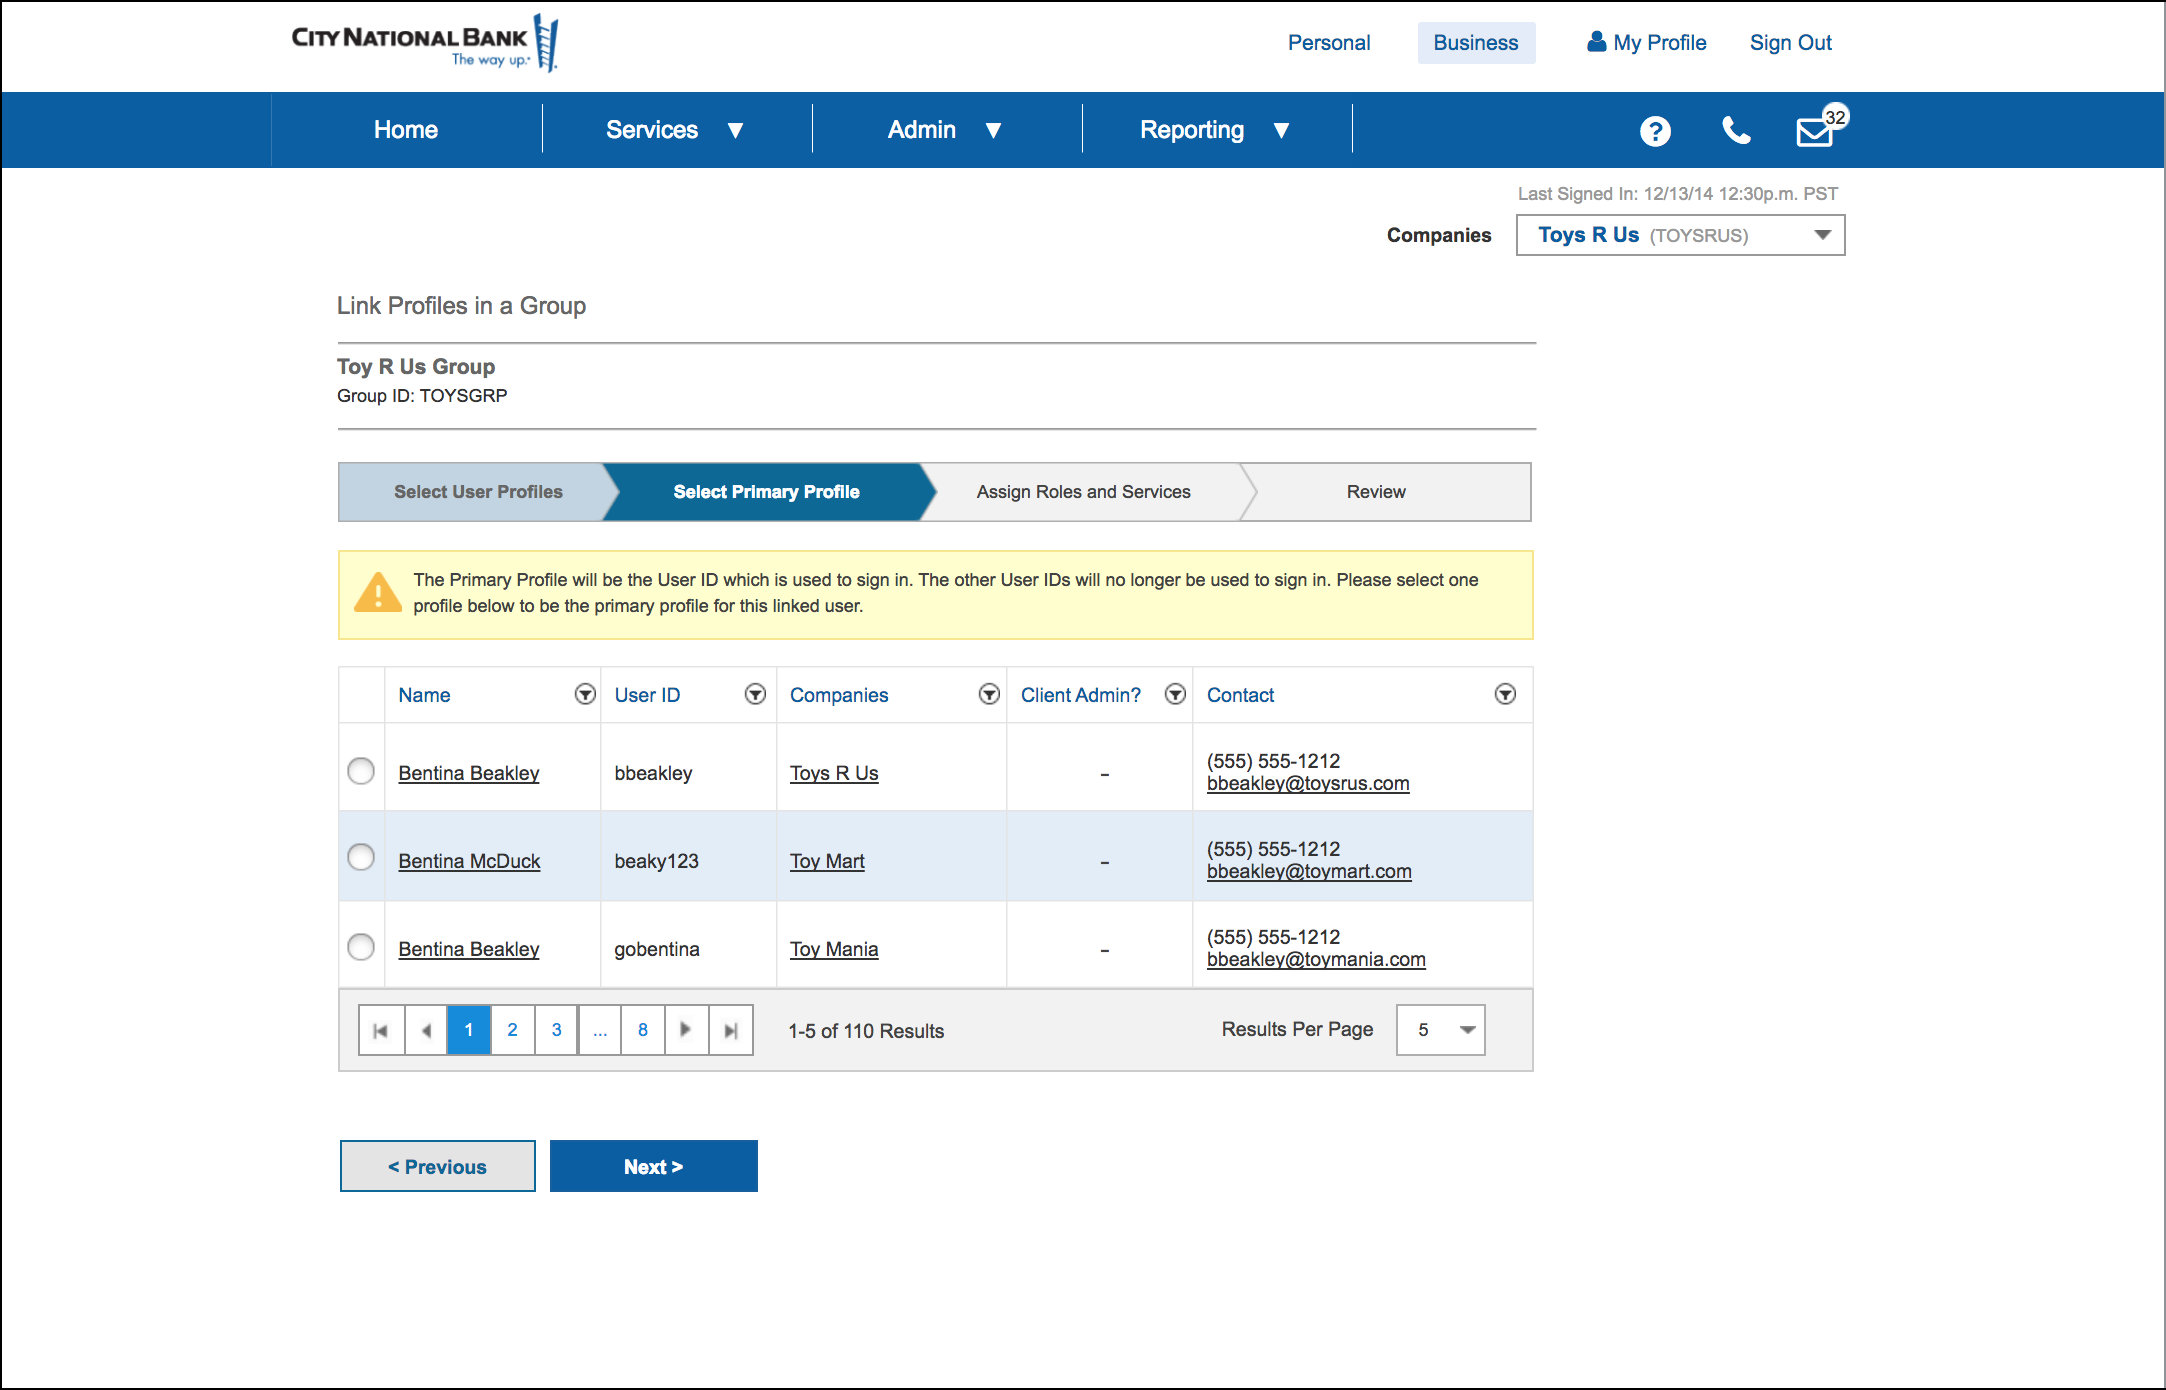
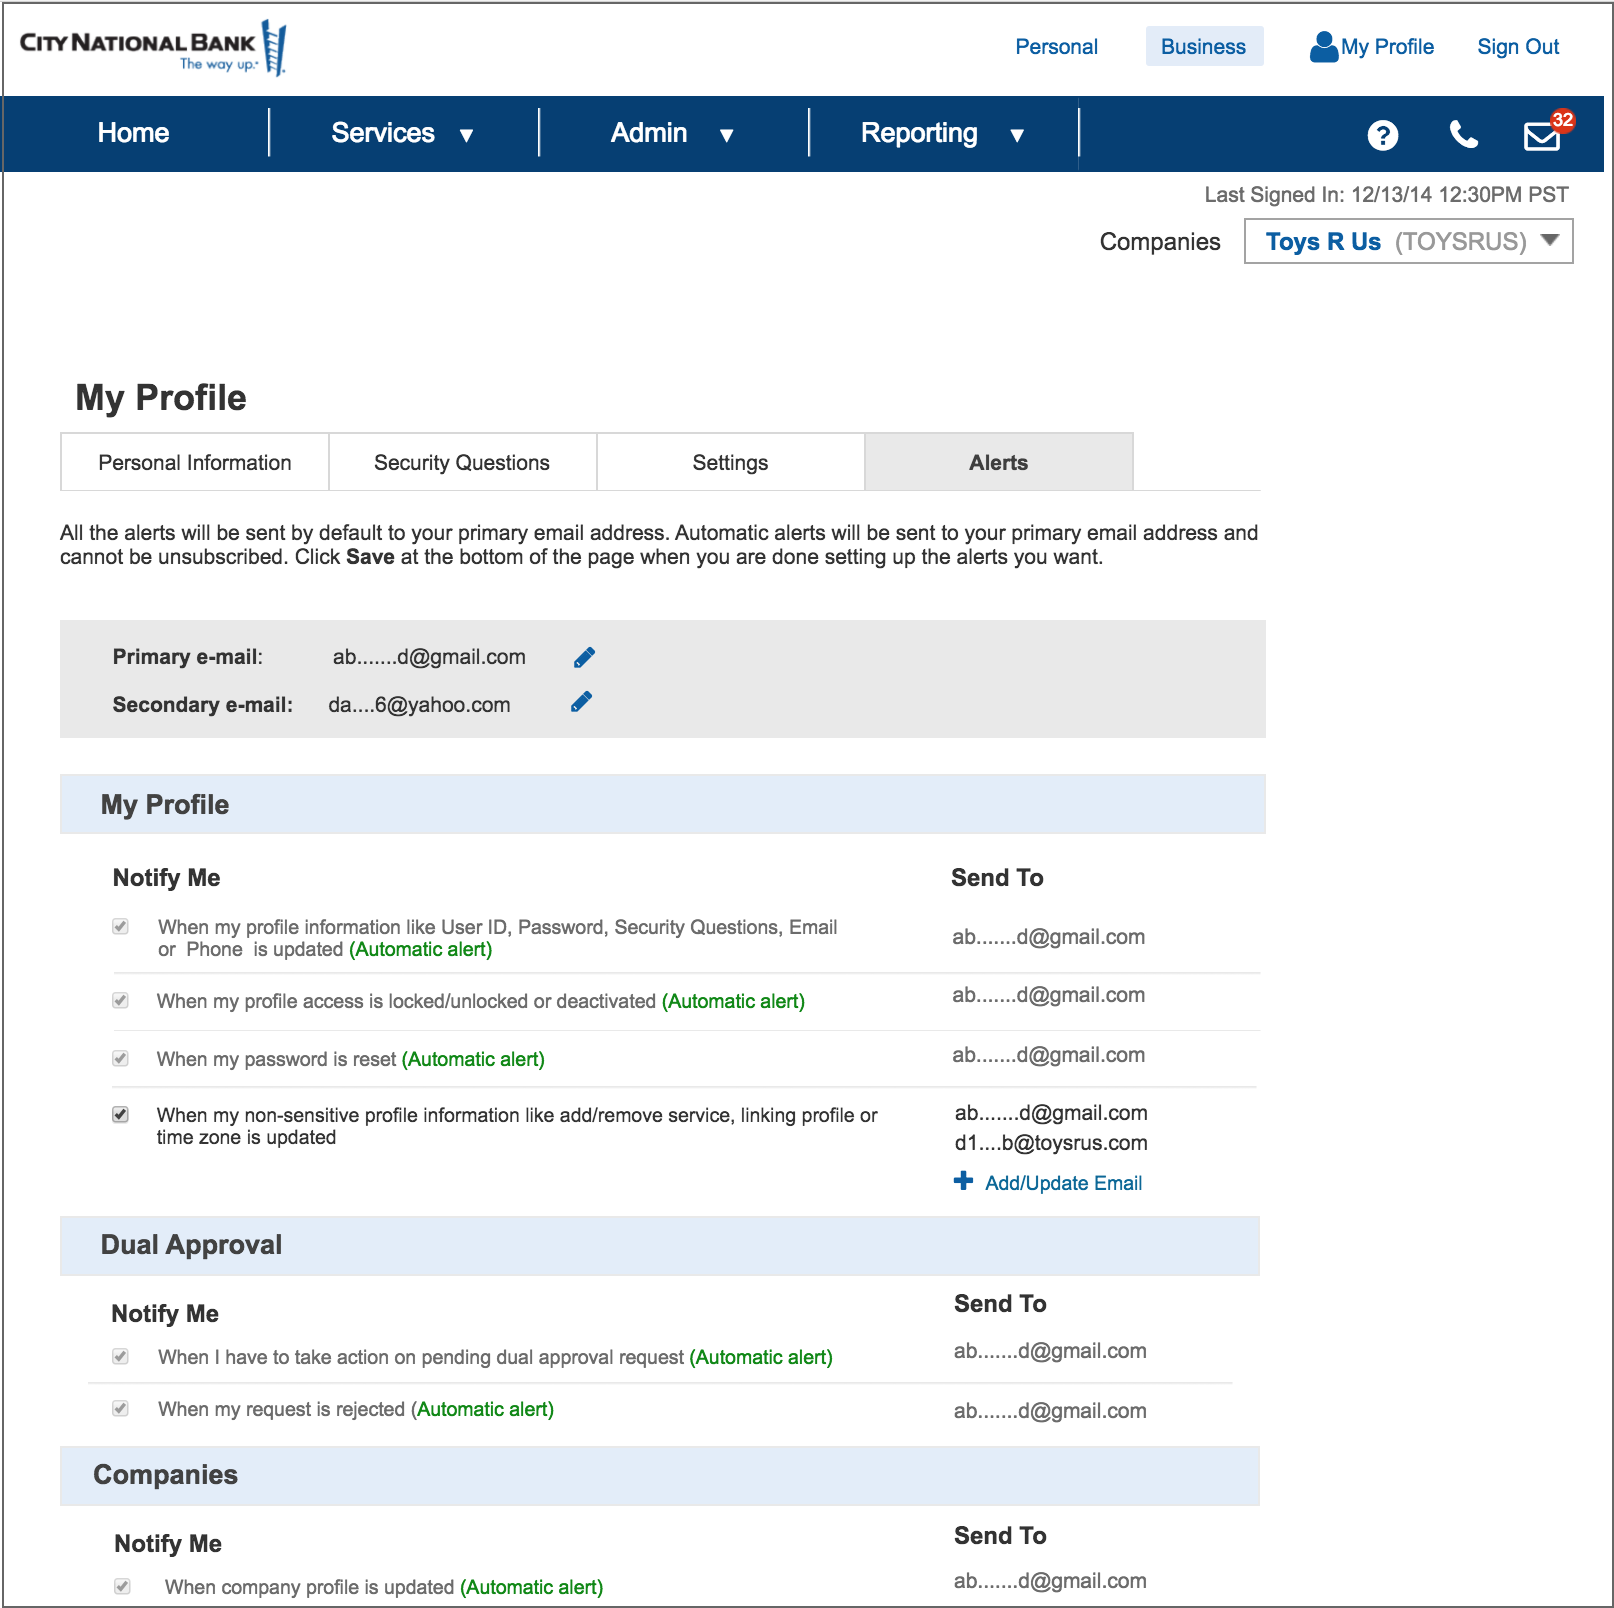
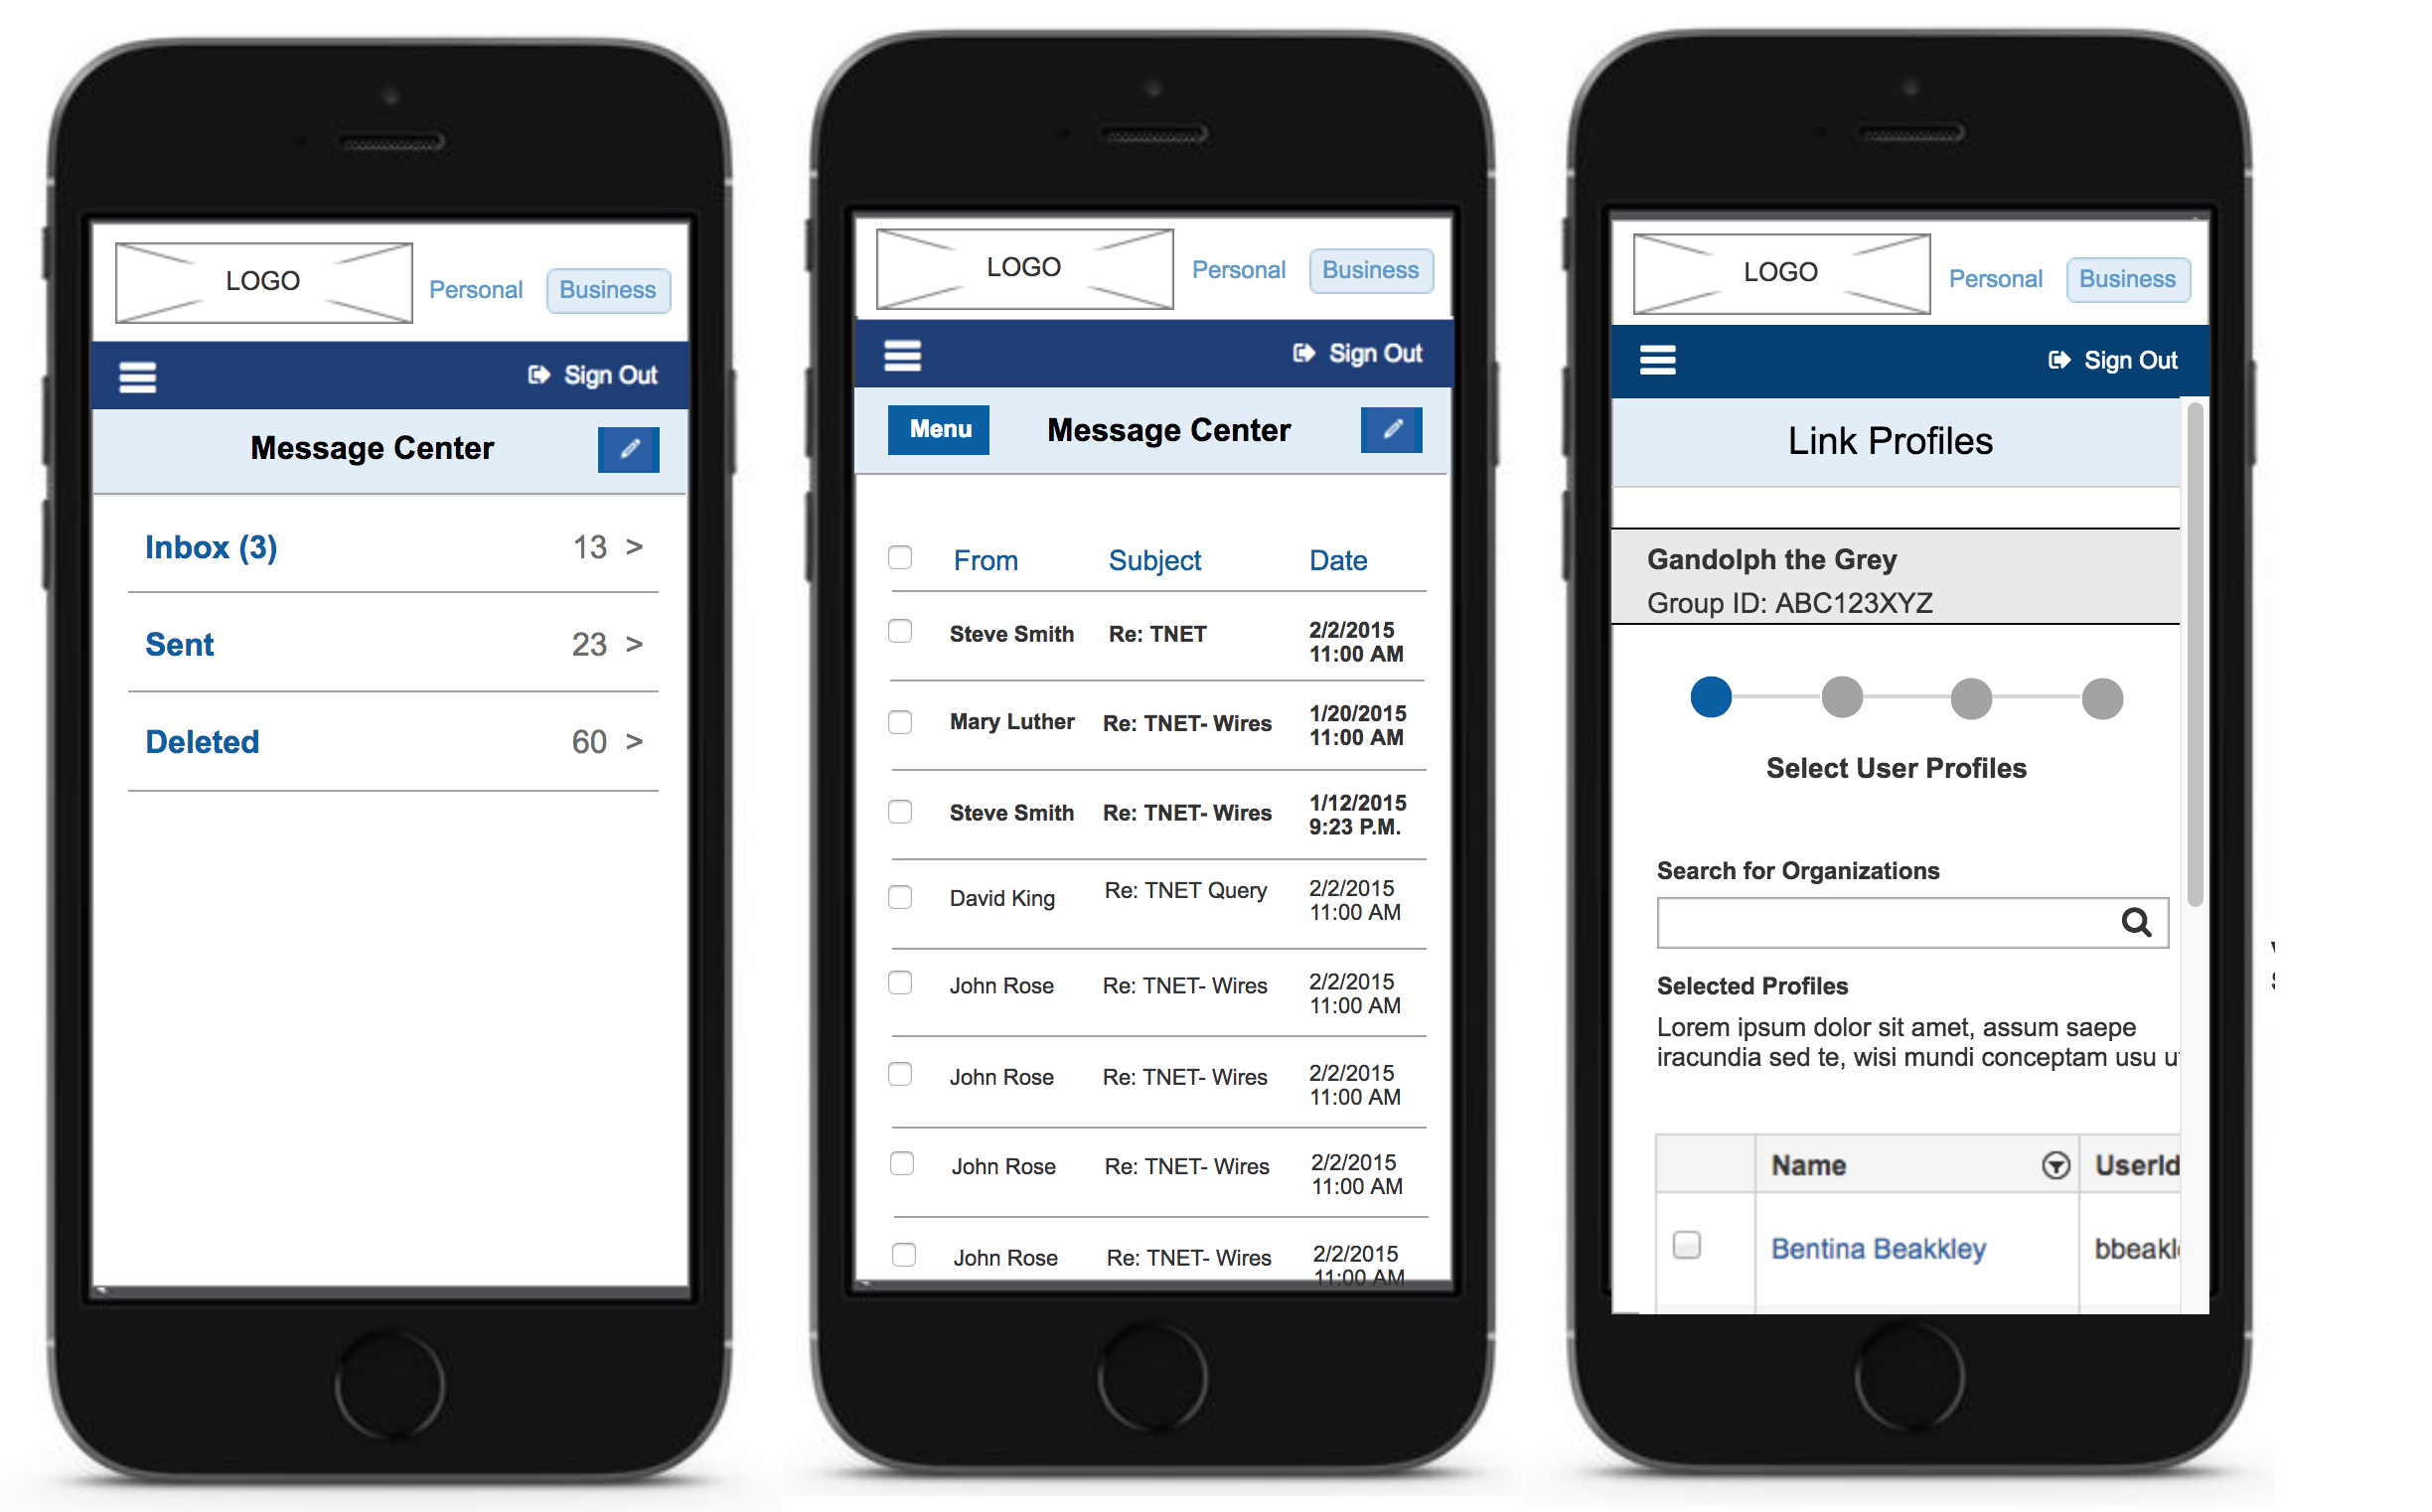
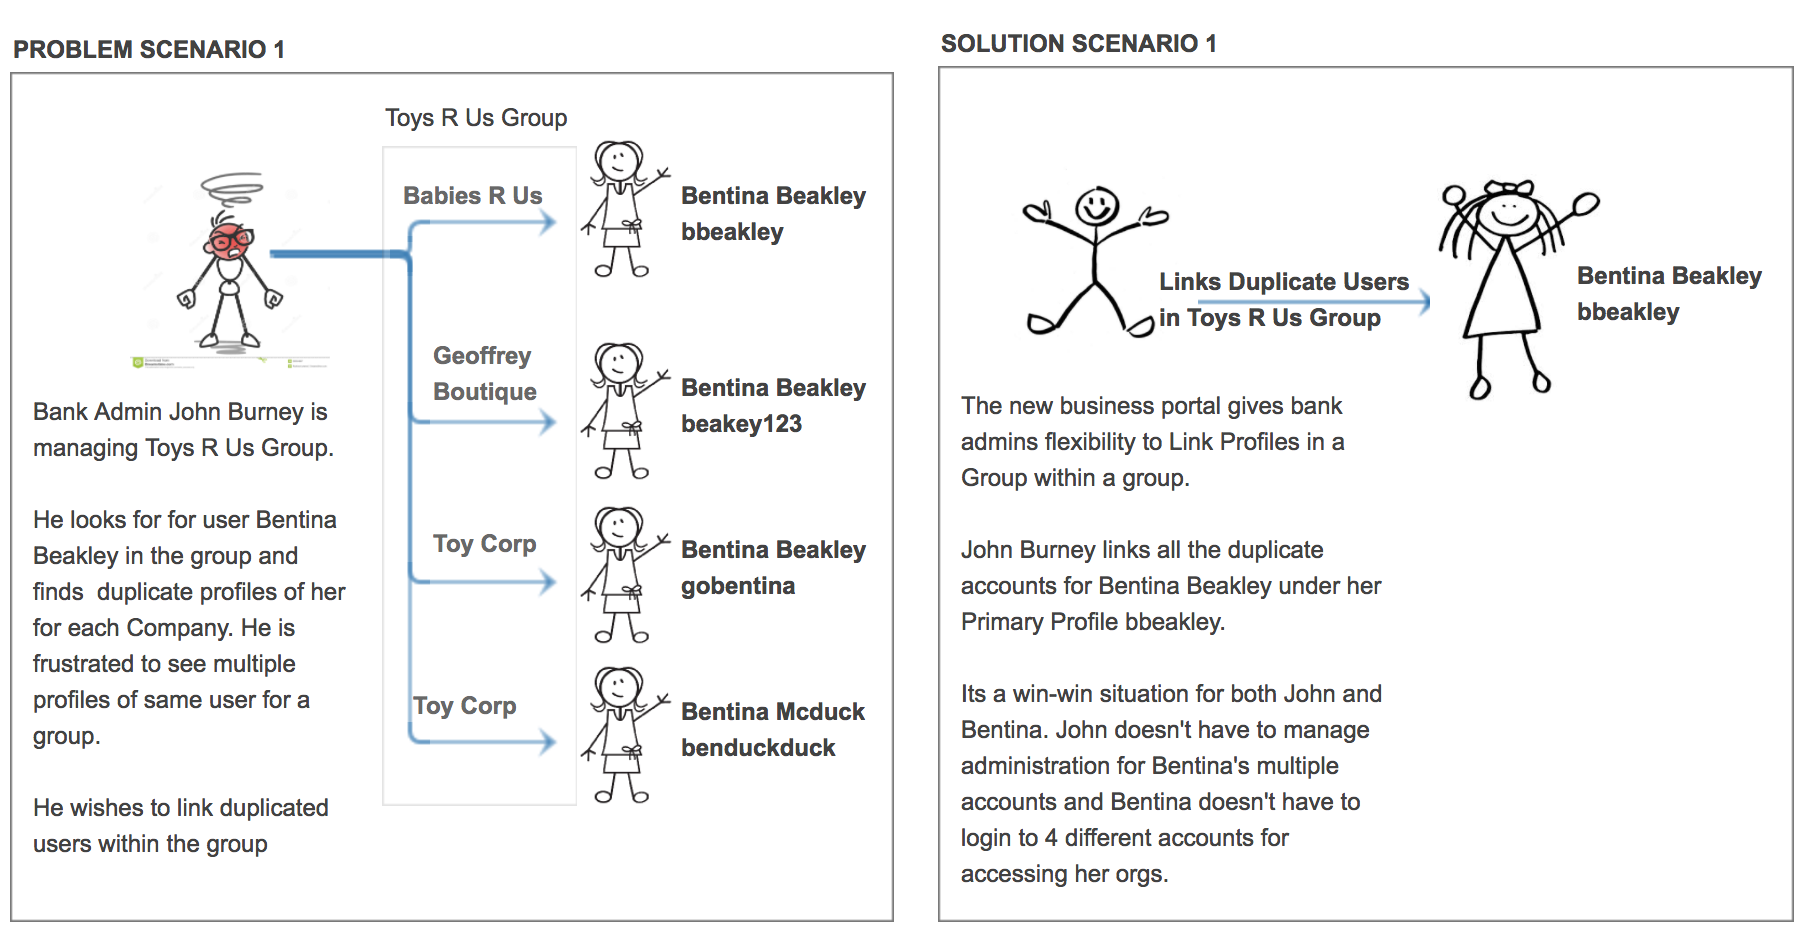
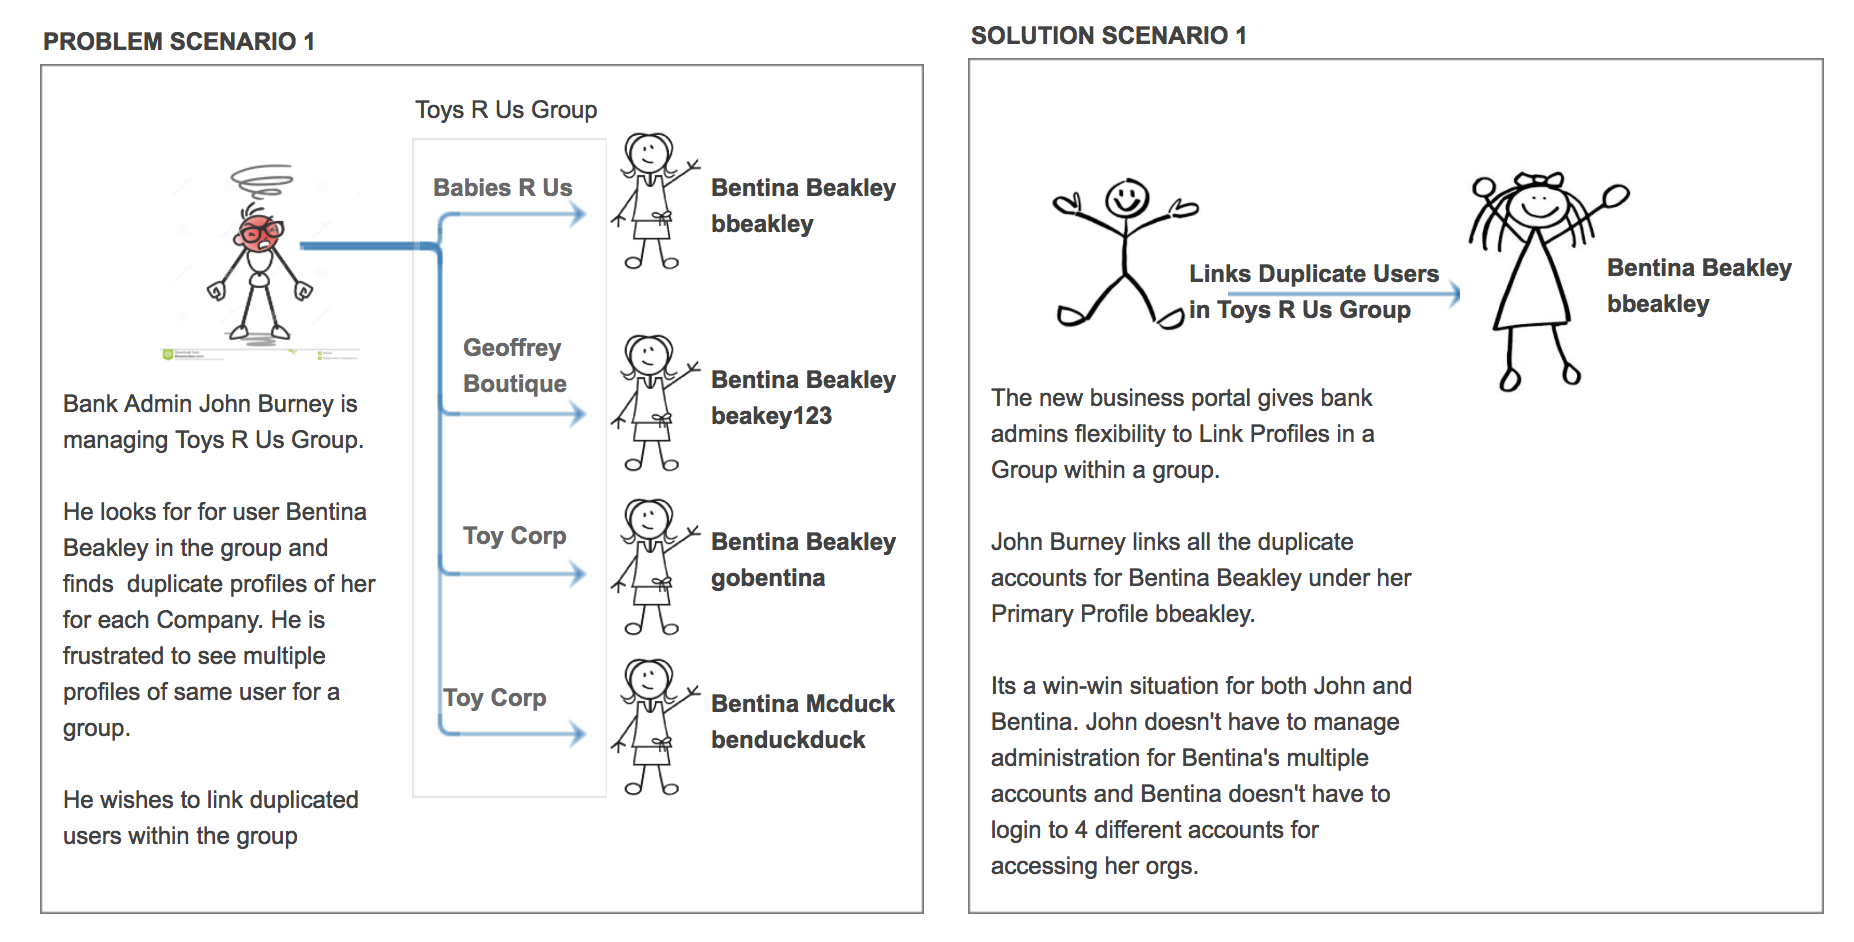
The goal of the project was to design a business online portal having capabilities for client admin, bank admin, client user and bank user. The portal should have capability to sign in users, MFA authentication, search users, link users, group users, integrate with 3rd party, messaging, notifications, dual approval, manage profile, lock/unlock/activate/deactivate users and setup entitlements. The portal should support cross browser and cross device experience. The goal of the Portal strategy was to create a streamlined customer experience for clients and colleagues.
We interviewed subject matter stakeholders from Treasury Management, Digital Channels, and Product Strategies team separately as well as together to gather and define requirements We used Axure to develop interactive designs and presented the design to business owners. Once the design was approved by the owners, it went through development cycle. Finally the visual design was applied based on the style guide and polished comps.
I was responsible for designs in Axure and polished comps in Adobe Photoshop and Adobe Illustrator. front End Web development using HTML5, CSS, Angular JS,Kendo UI. I led UX QA testing efforts for Cross-browser and cross-platform issues

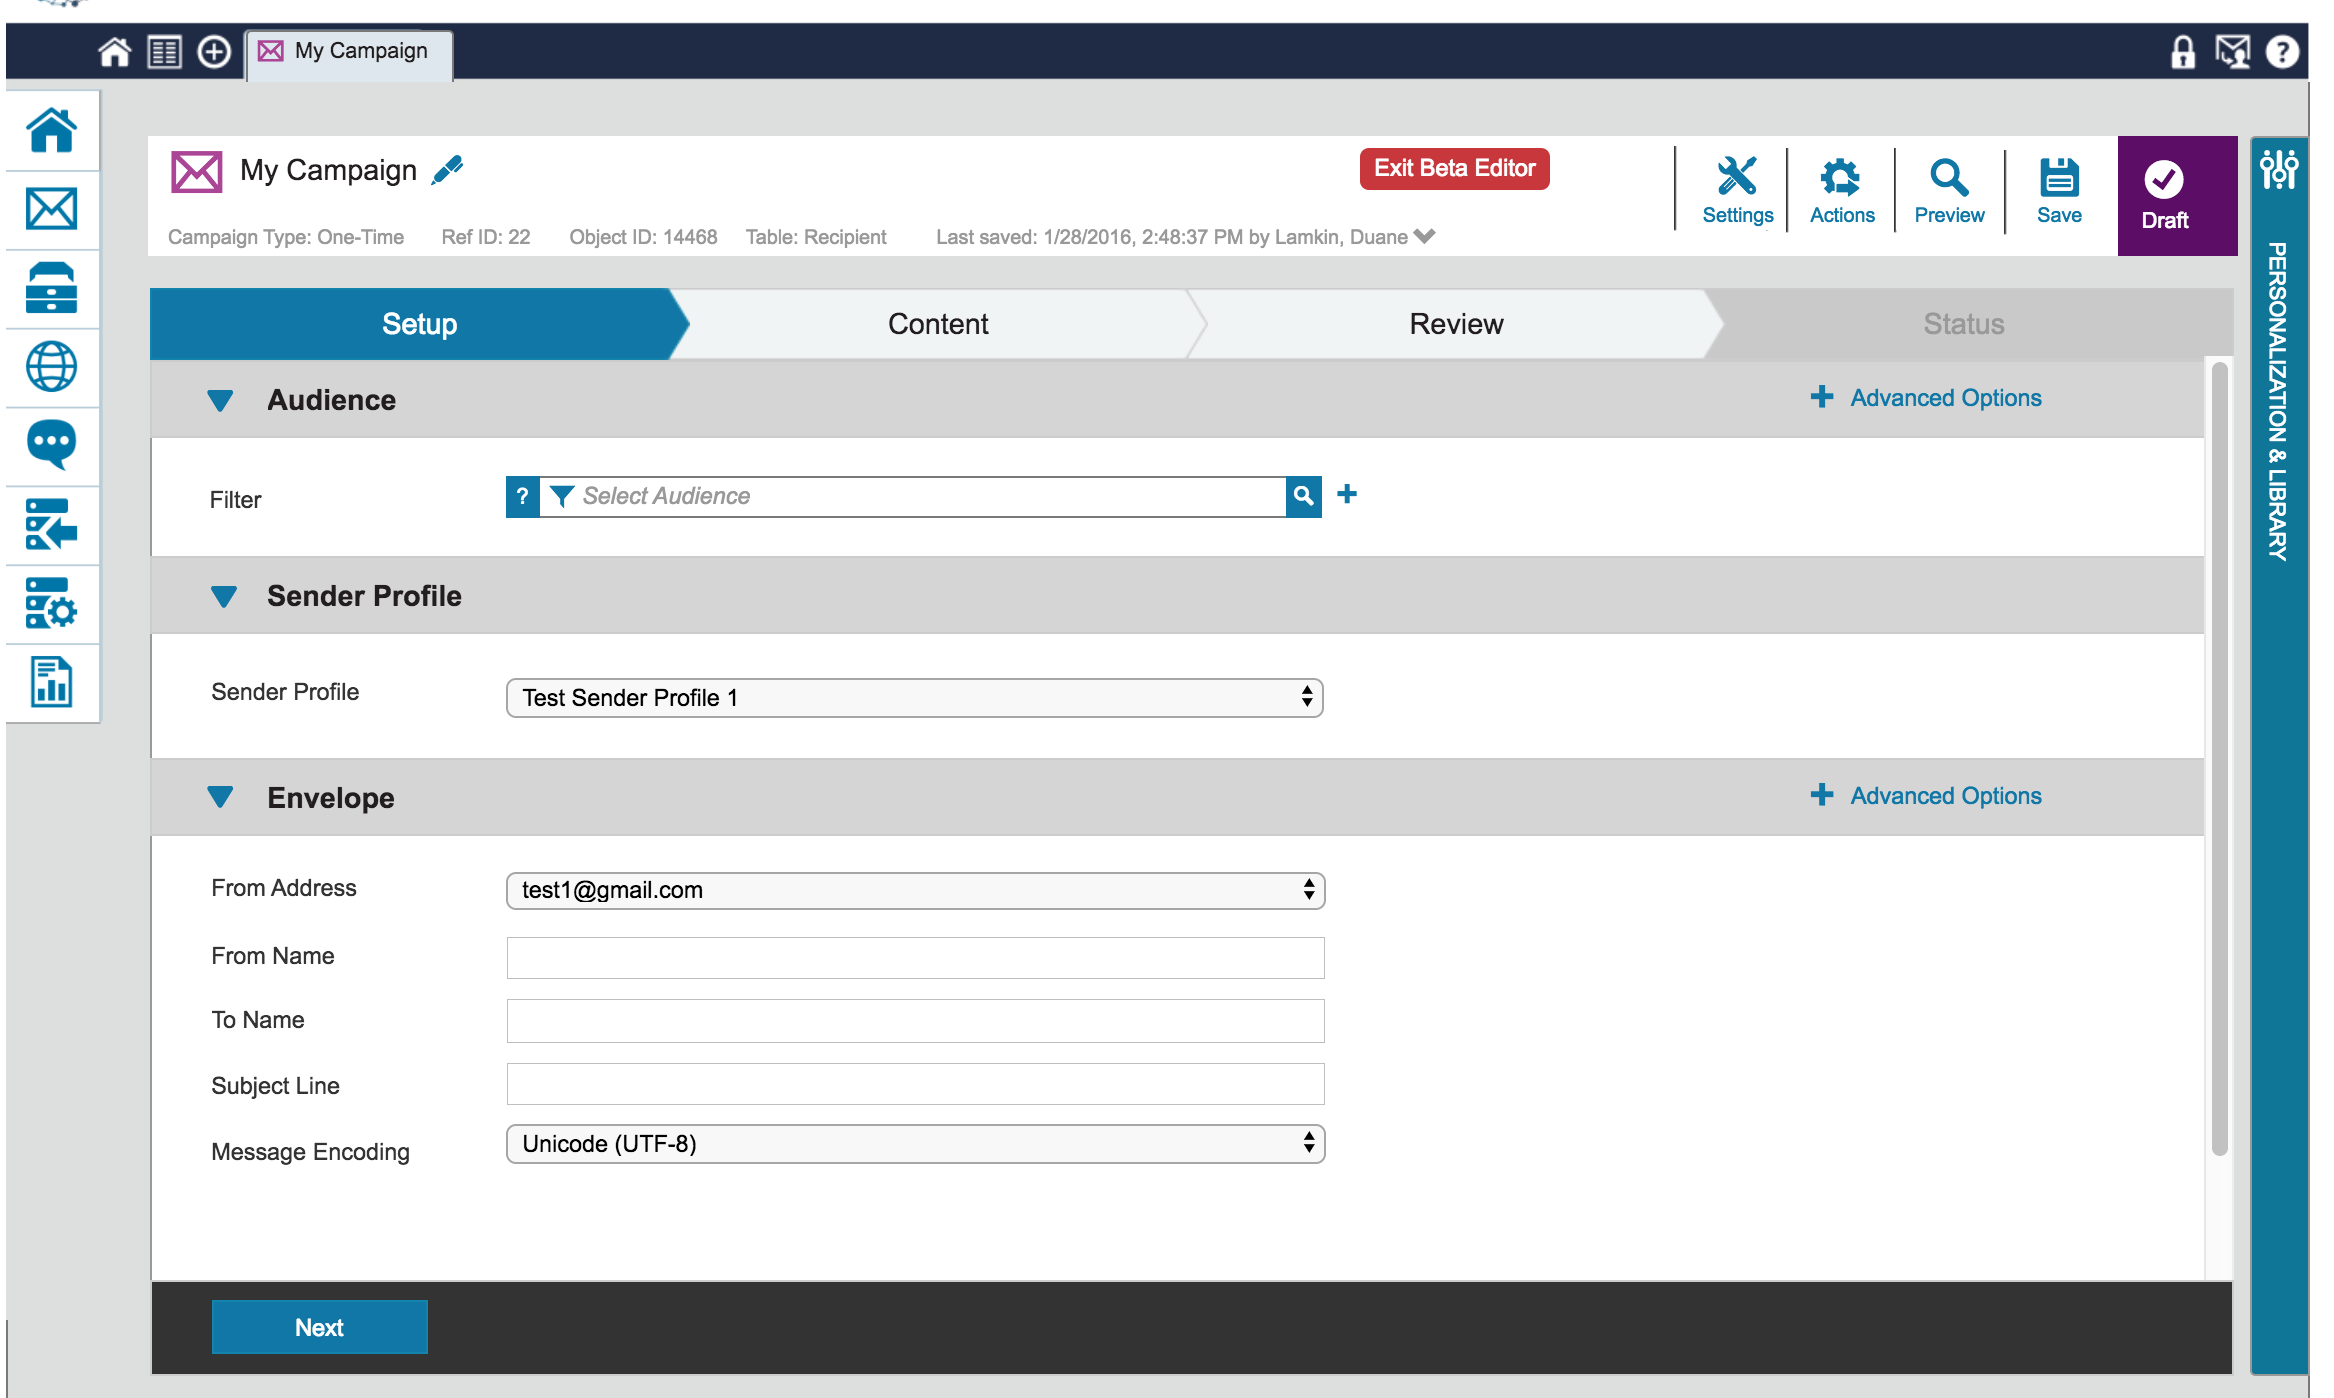
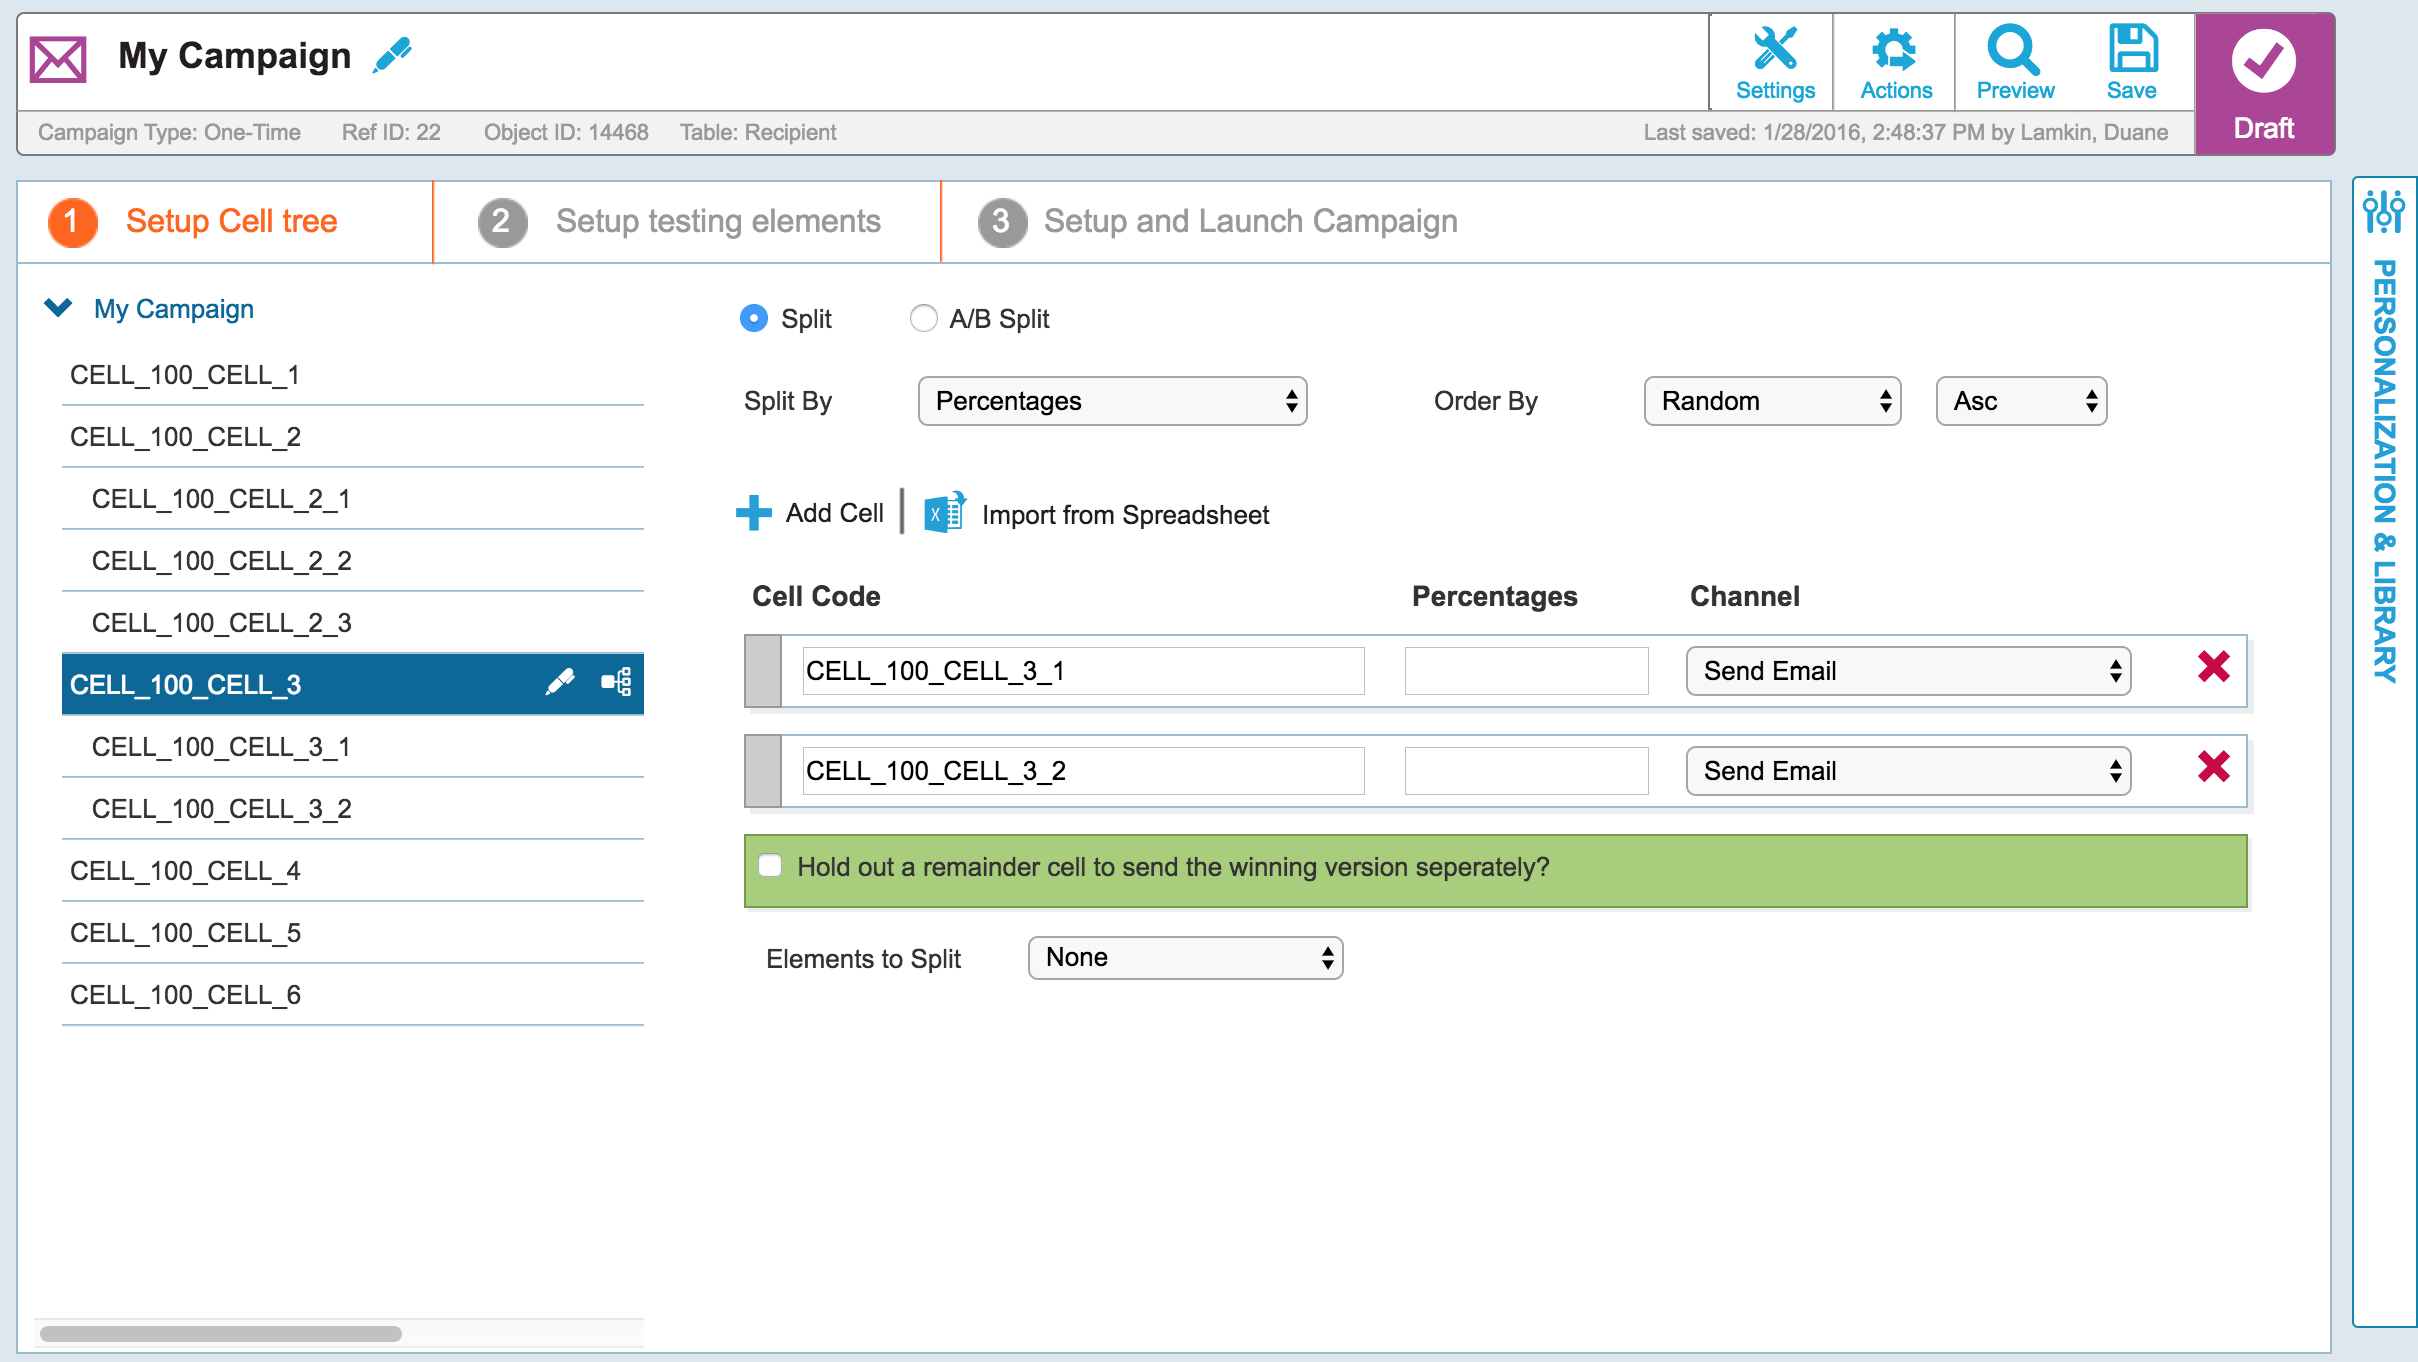
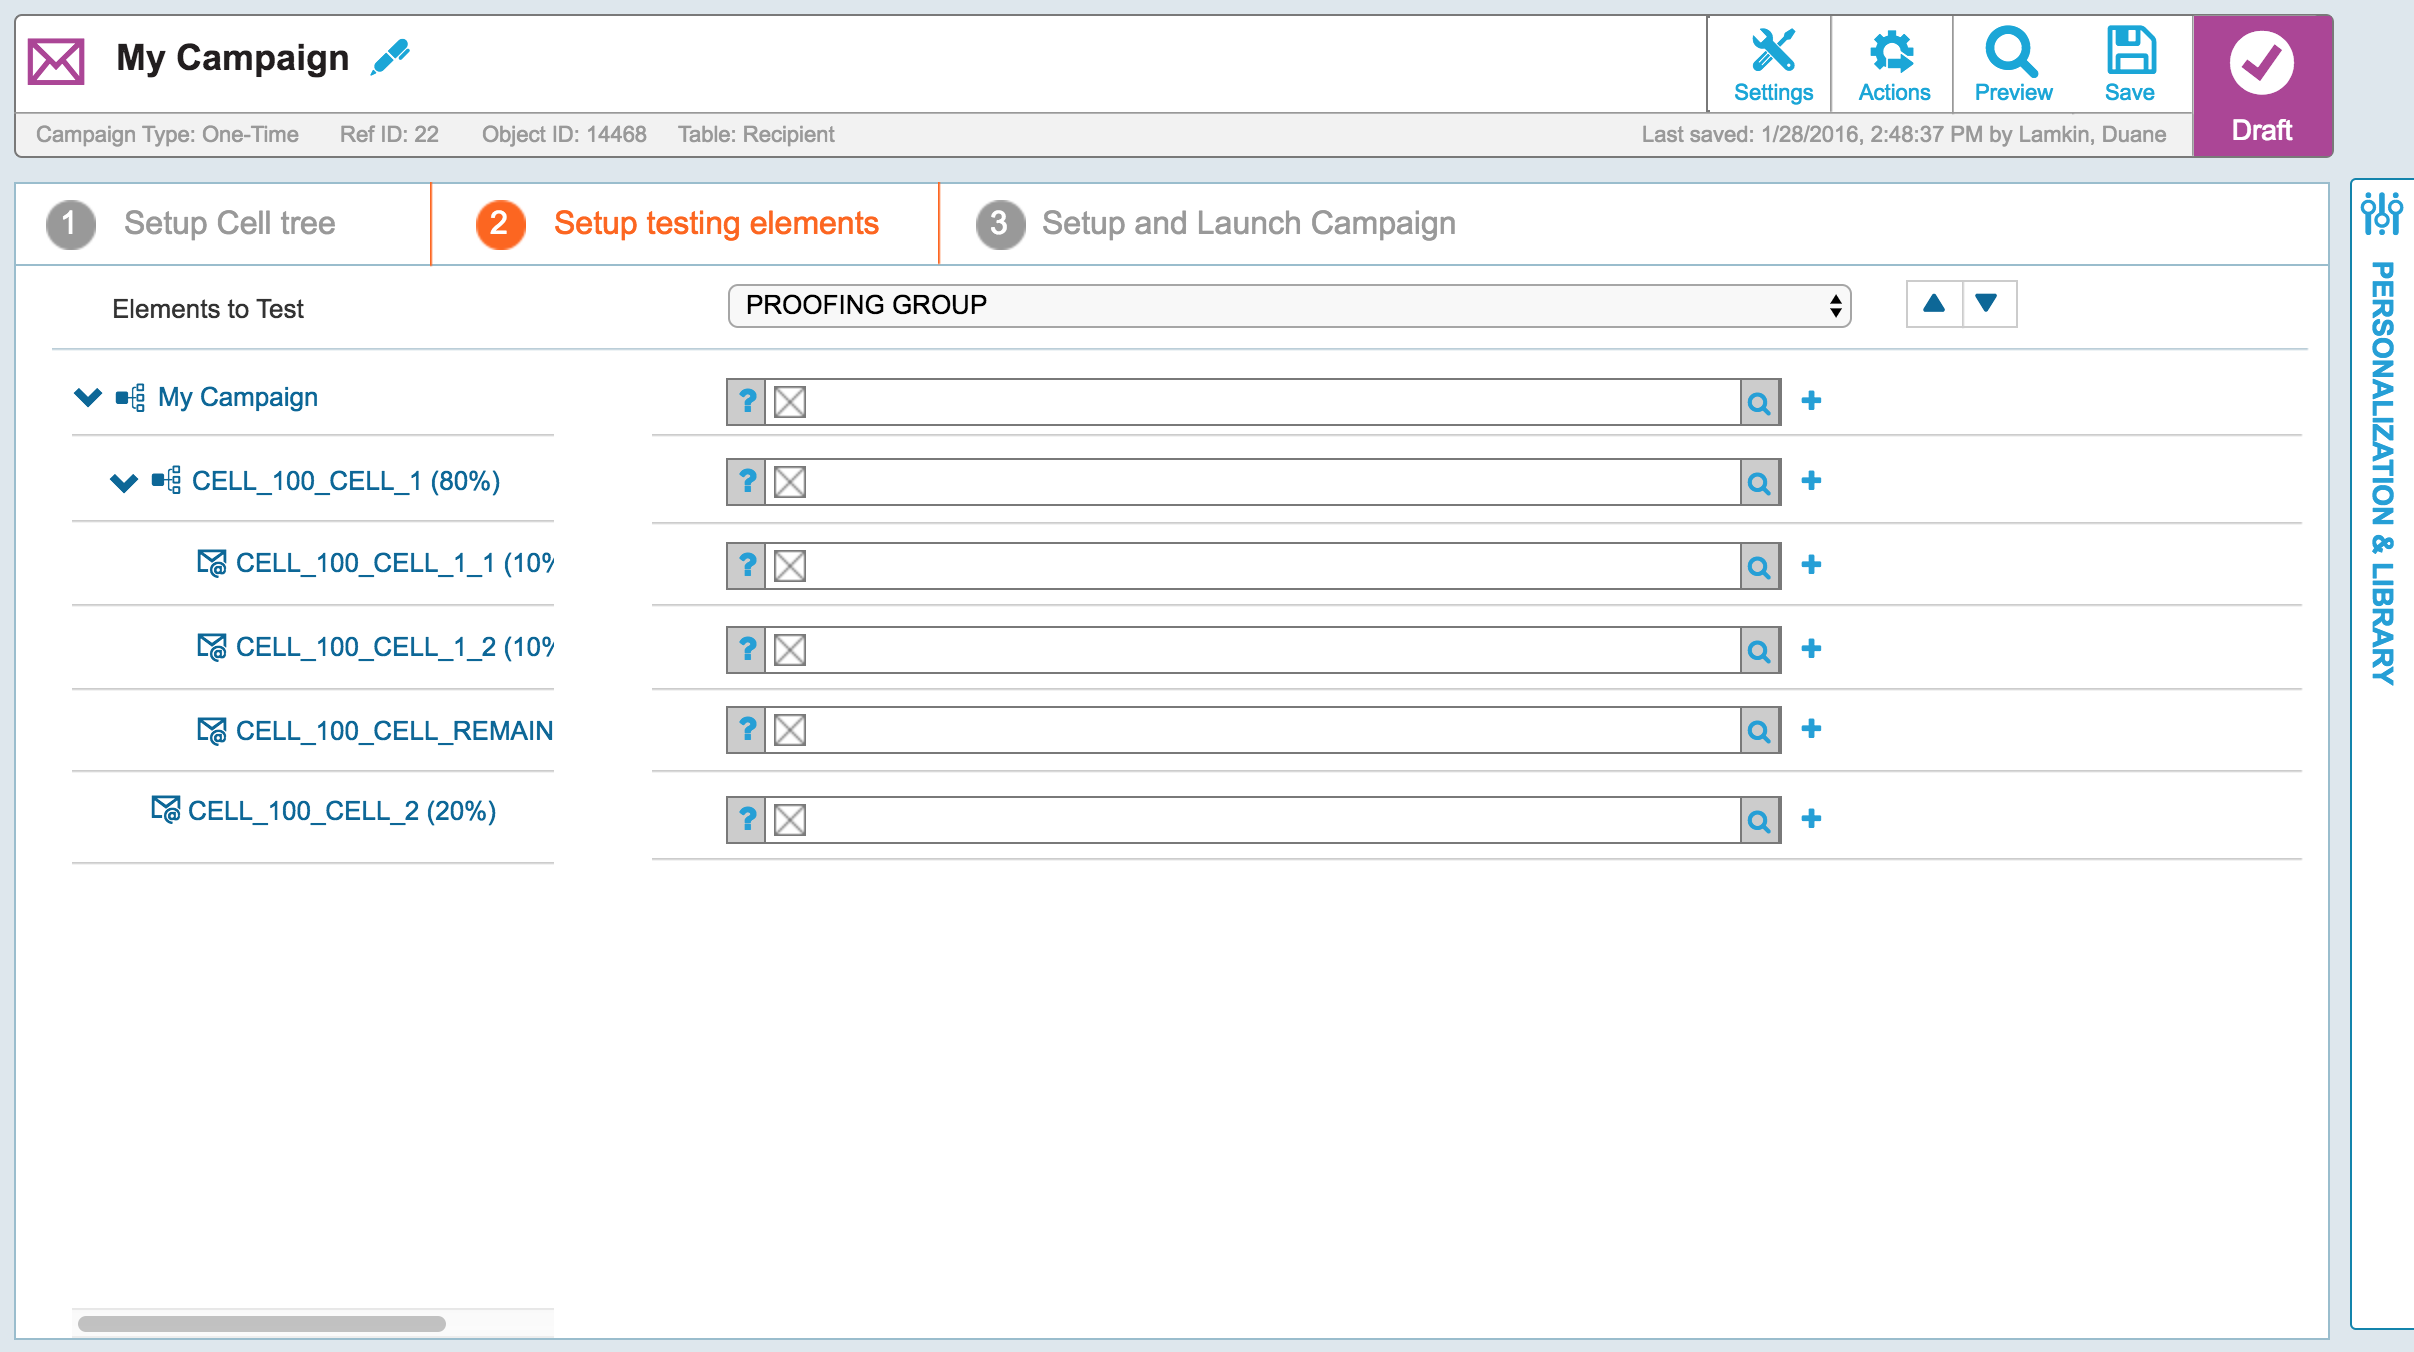
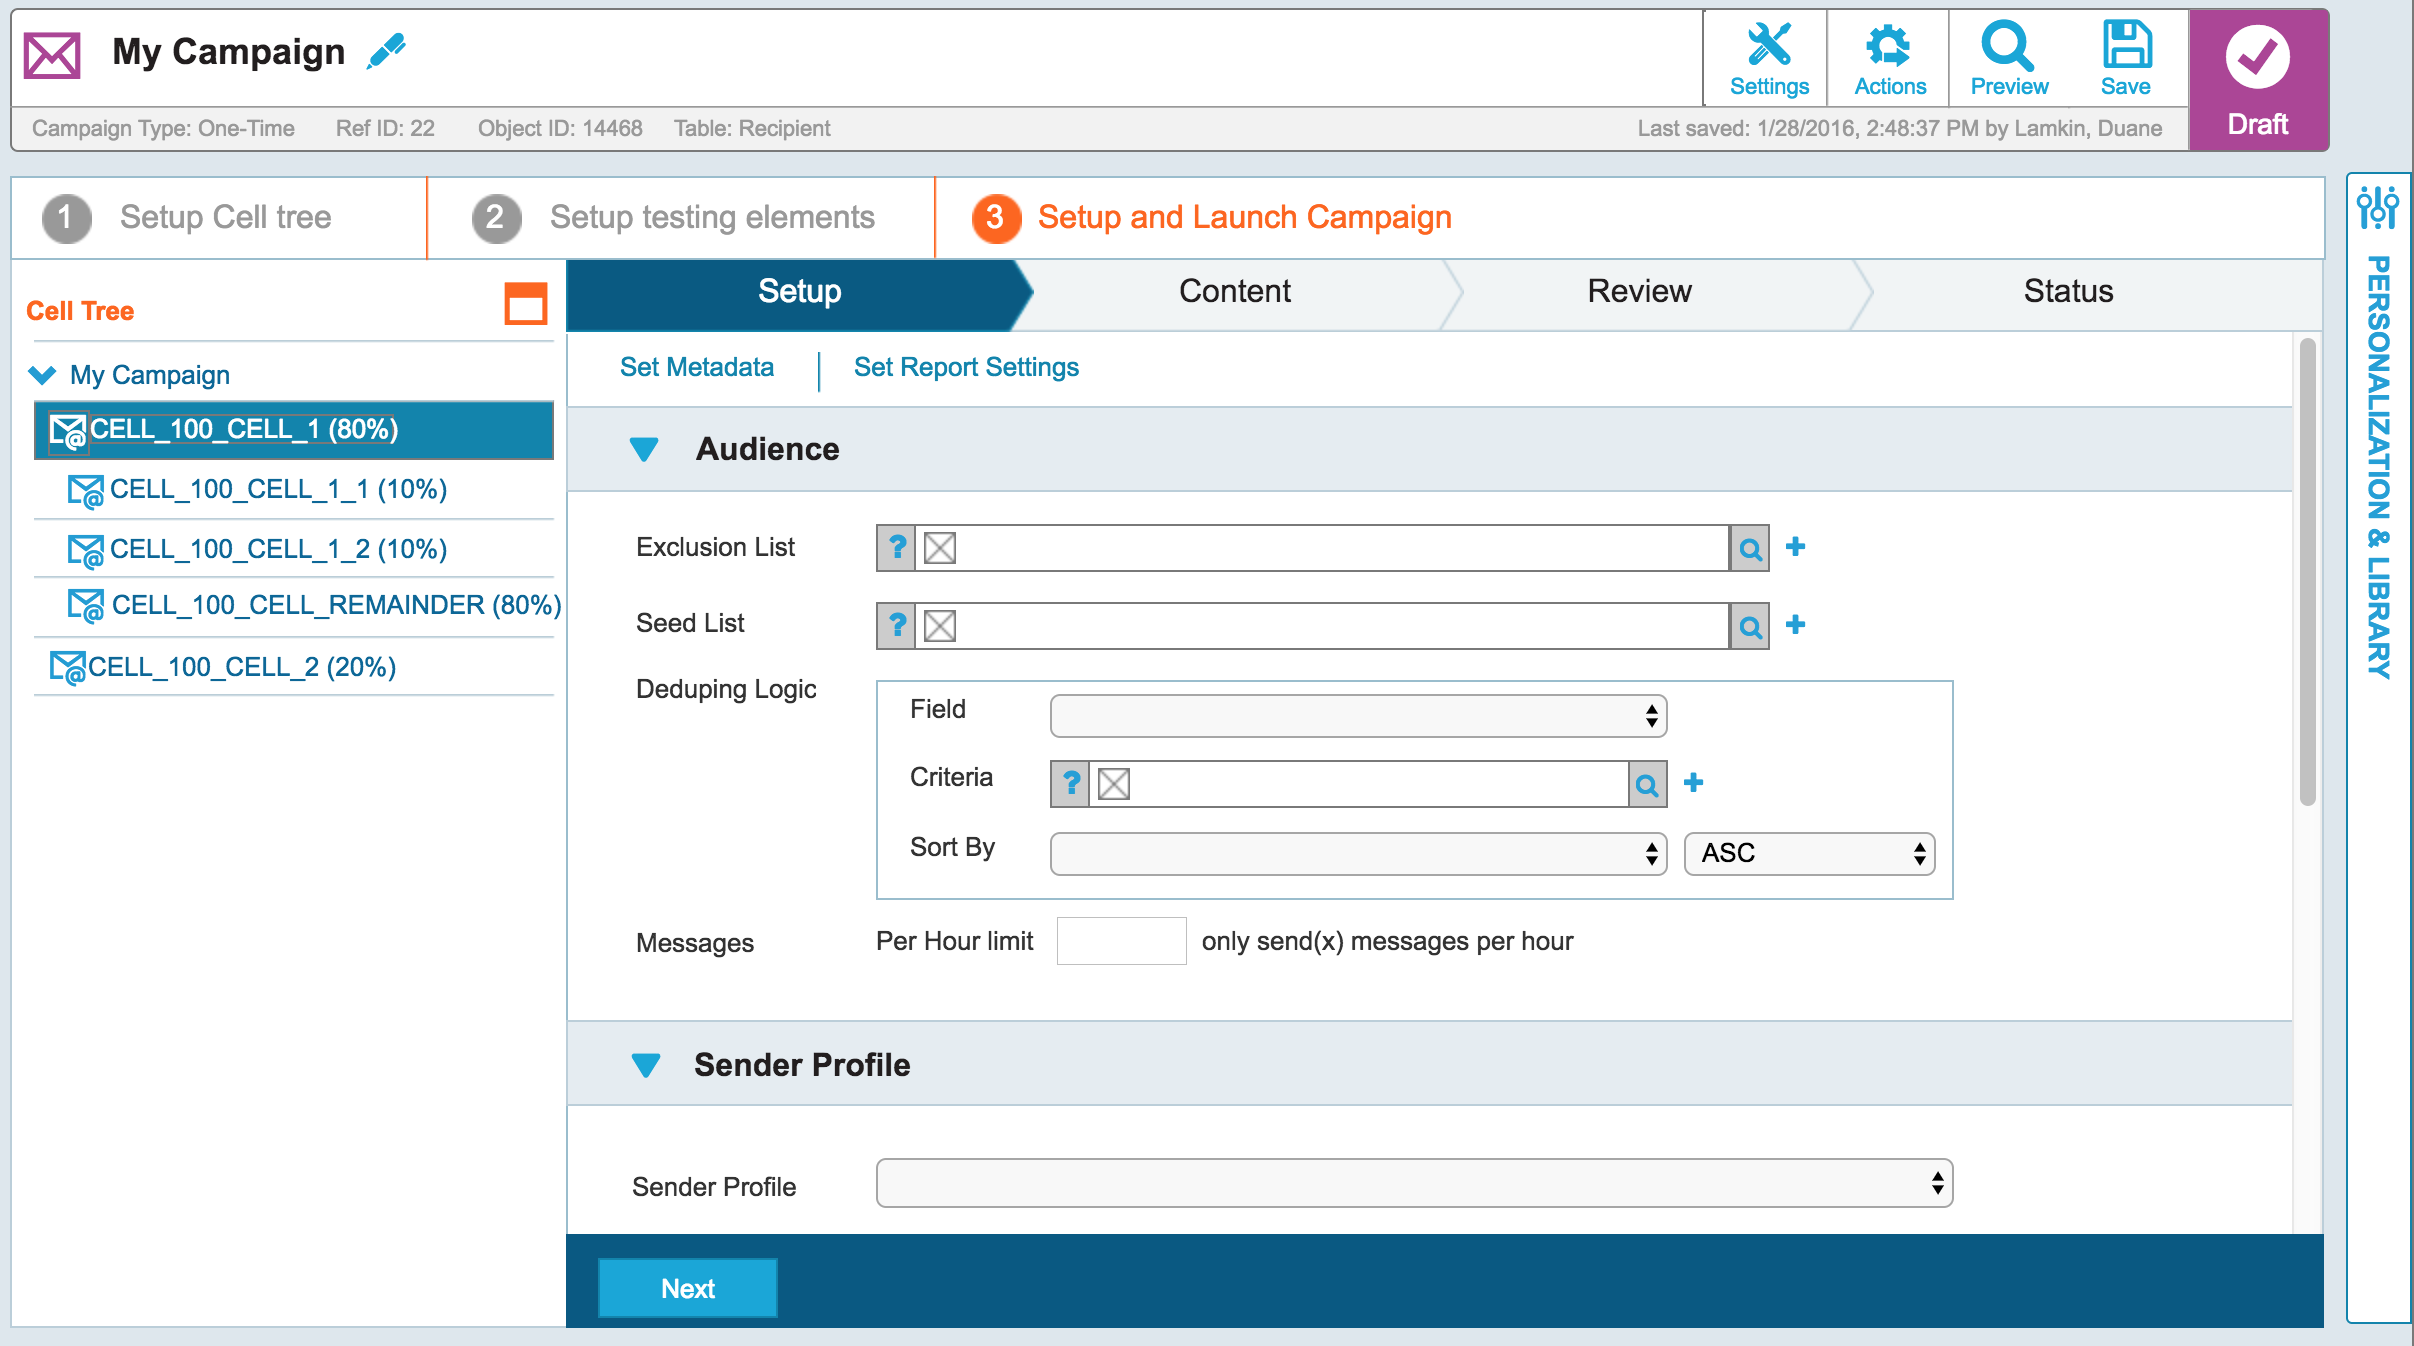
Experian Marketing Suite has lot of complex features, but they lacked ease of usability. My goal was to analyze the features, interact with stakeholders & customers and turn the complex features into easy and usable features.
I started by taking multiple trainings on the tool. I analyzed the features, conducted meetings with stakeholders, did sketching, white-boarding and finally designing in Axure. Axure is a tool which gives capability to build interactive prototypes and for such large application with array of features, Axure was a perfect tool to layout interactive design.
Issues Found:
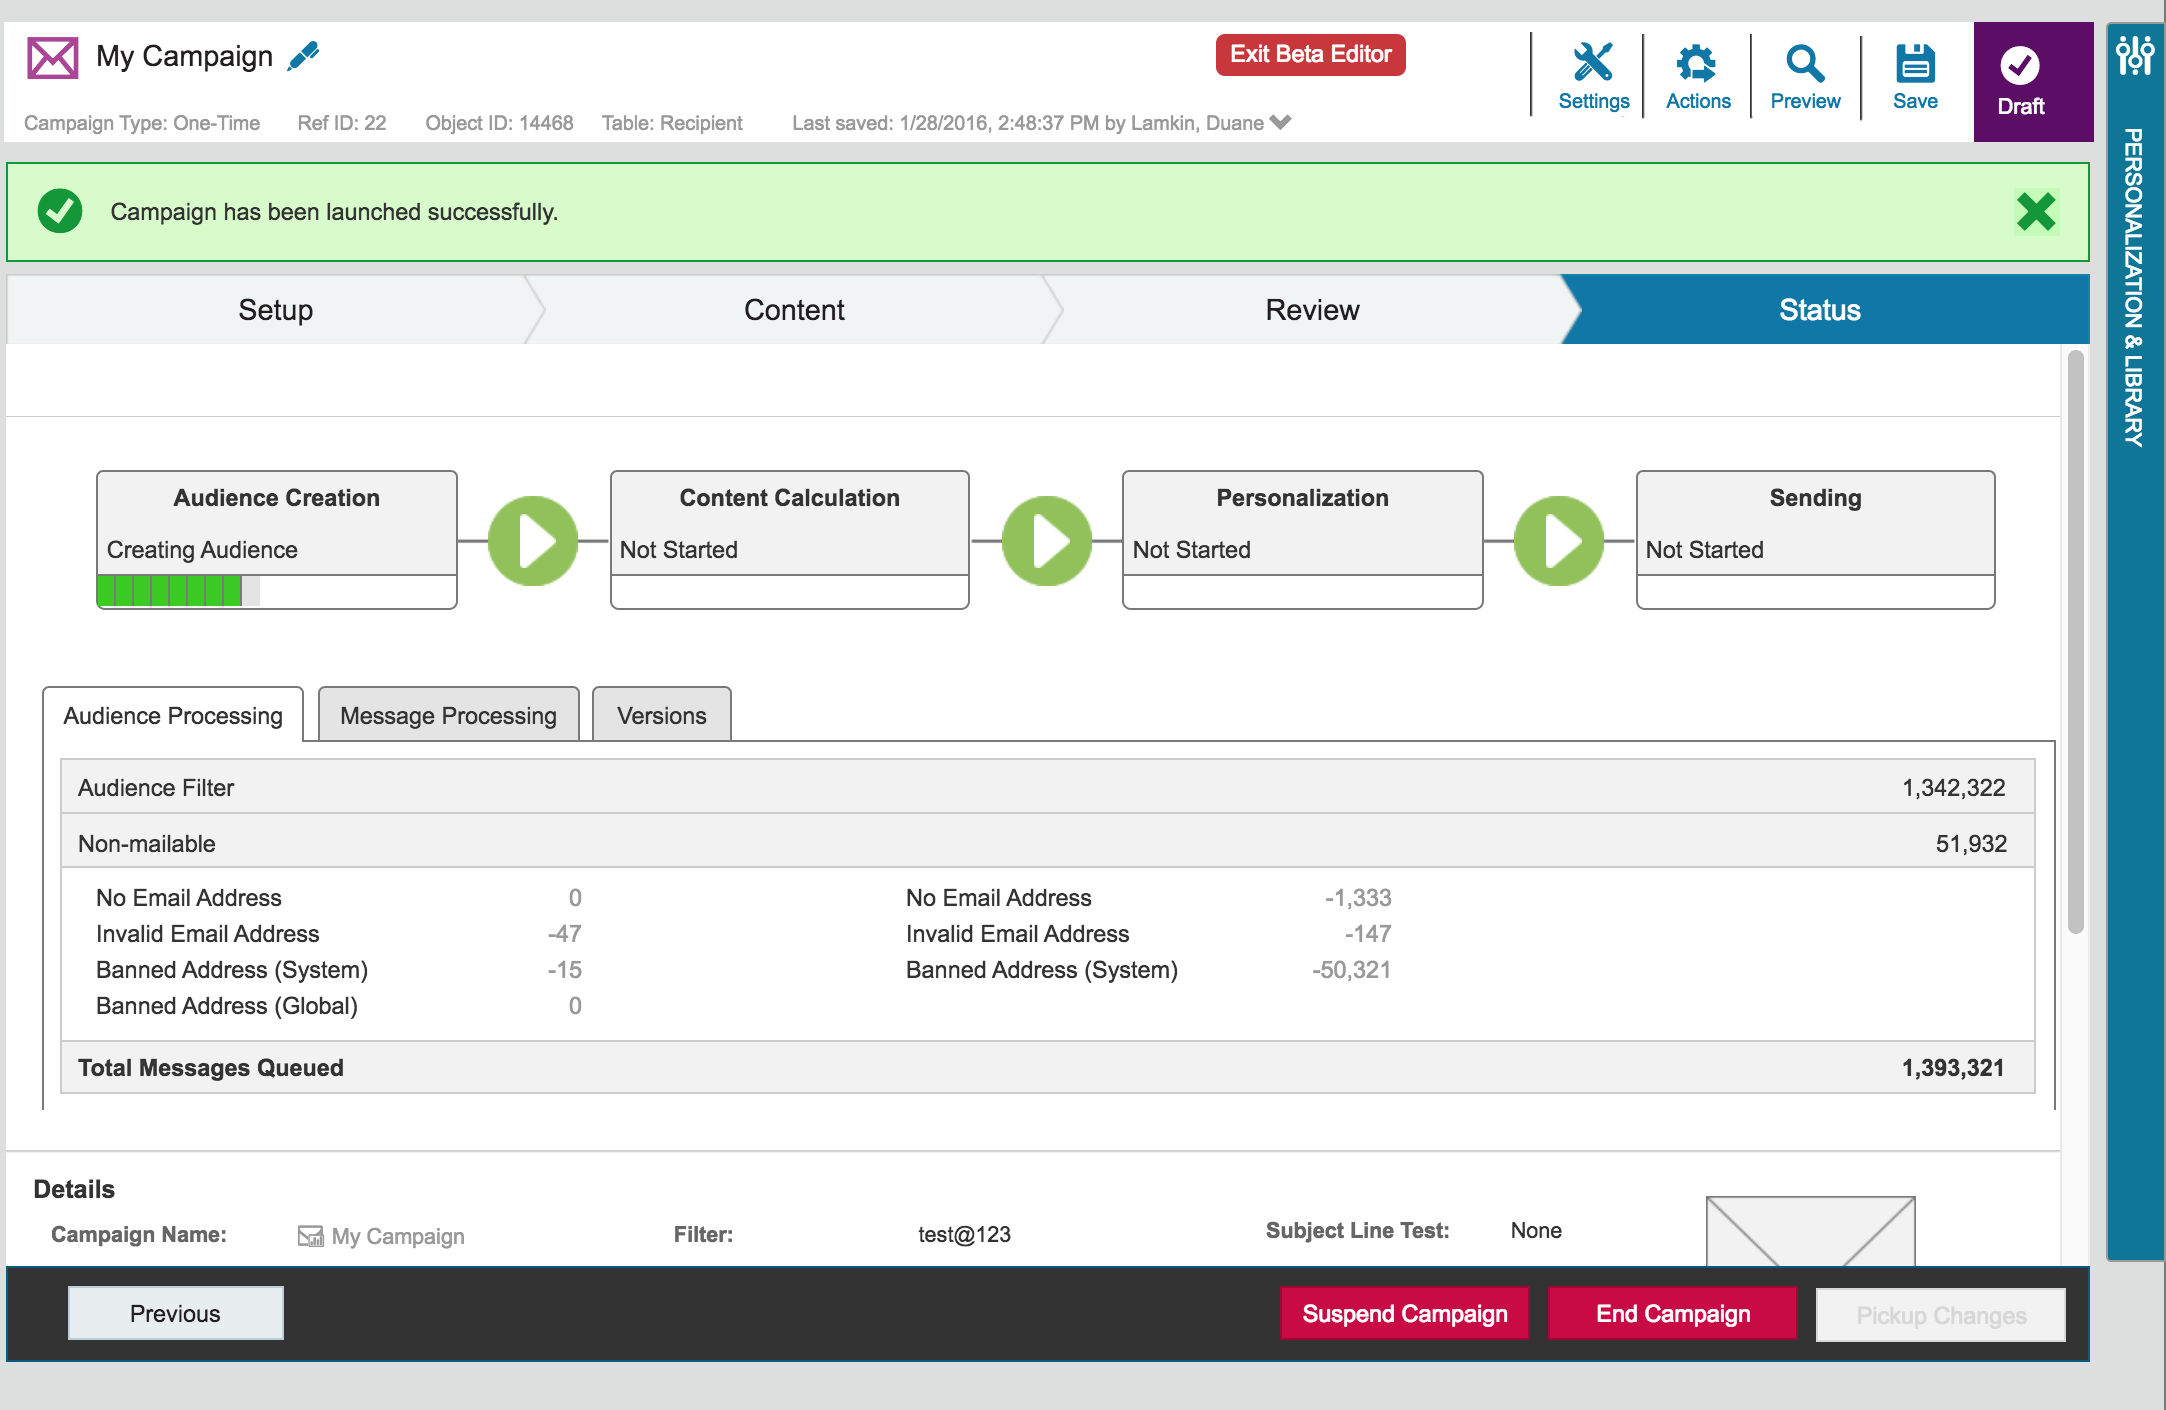
Campaign refactor prototype link
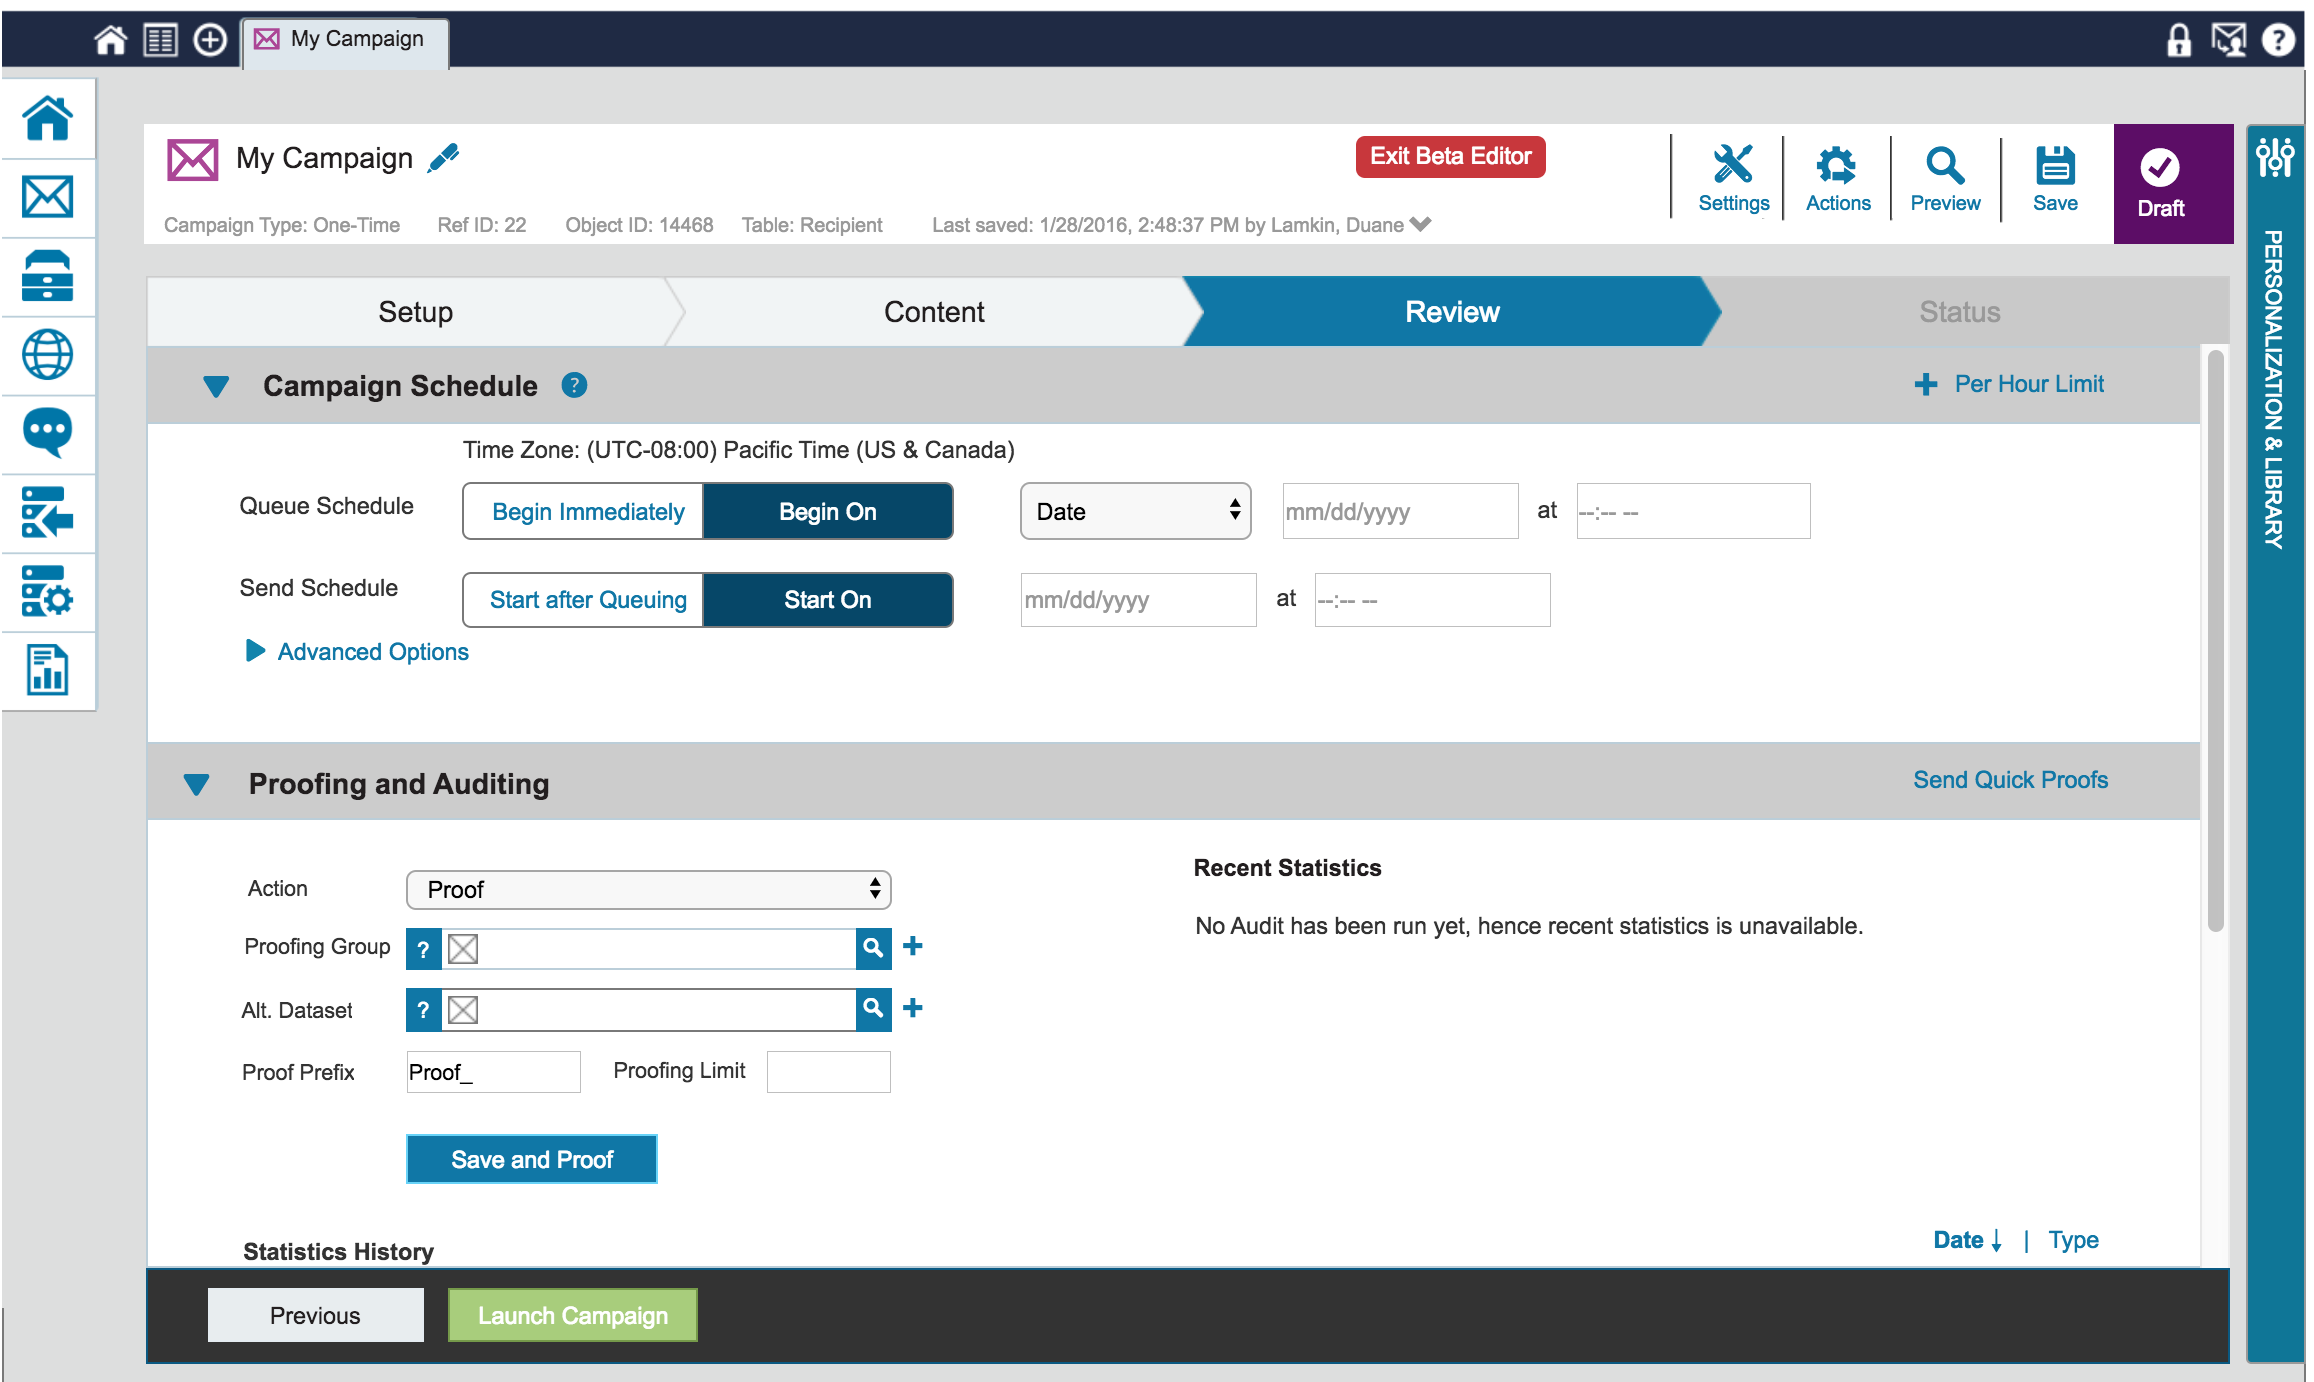
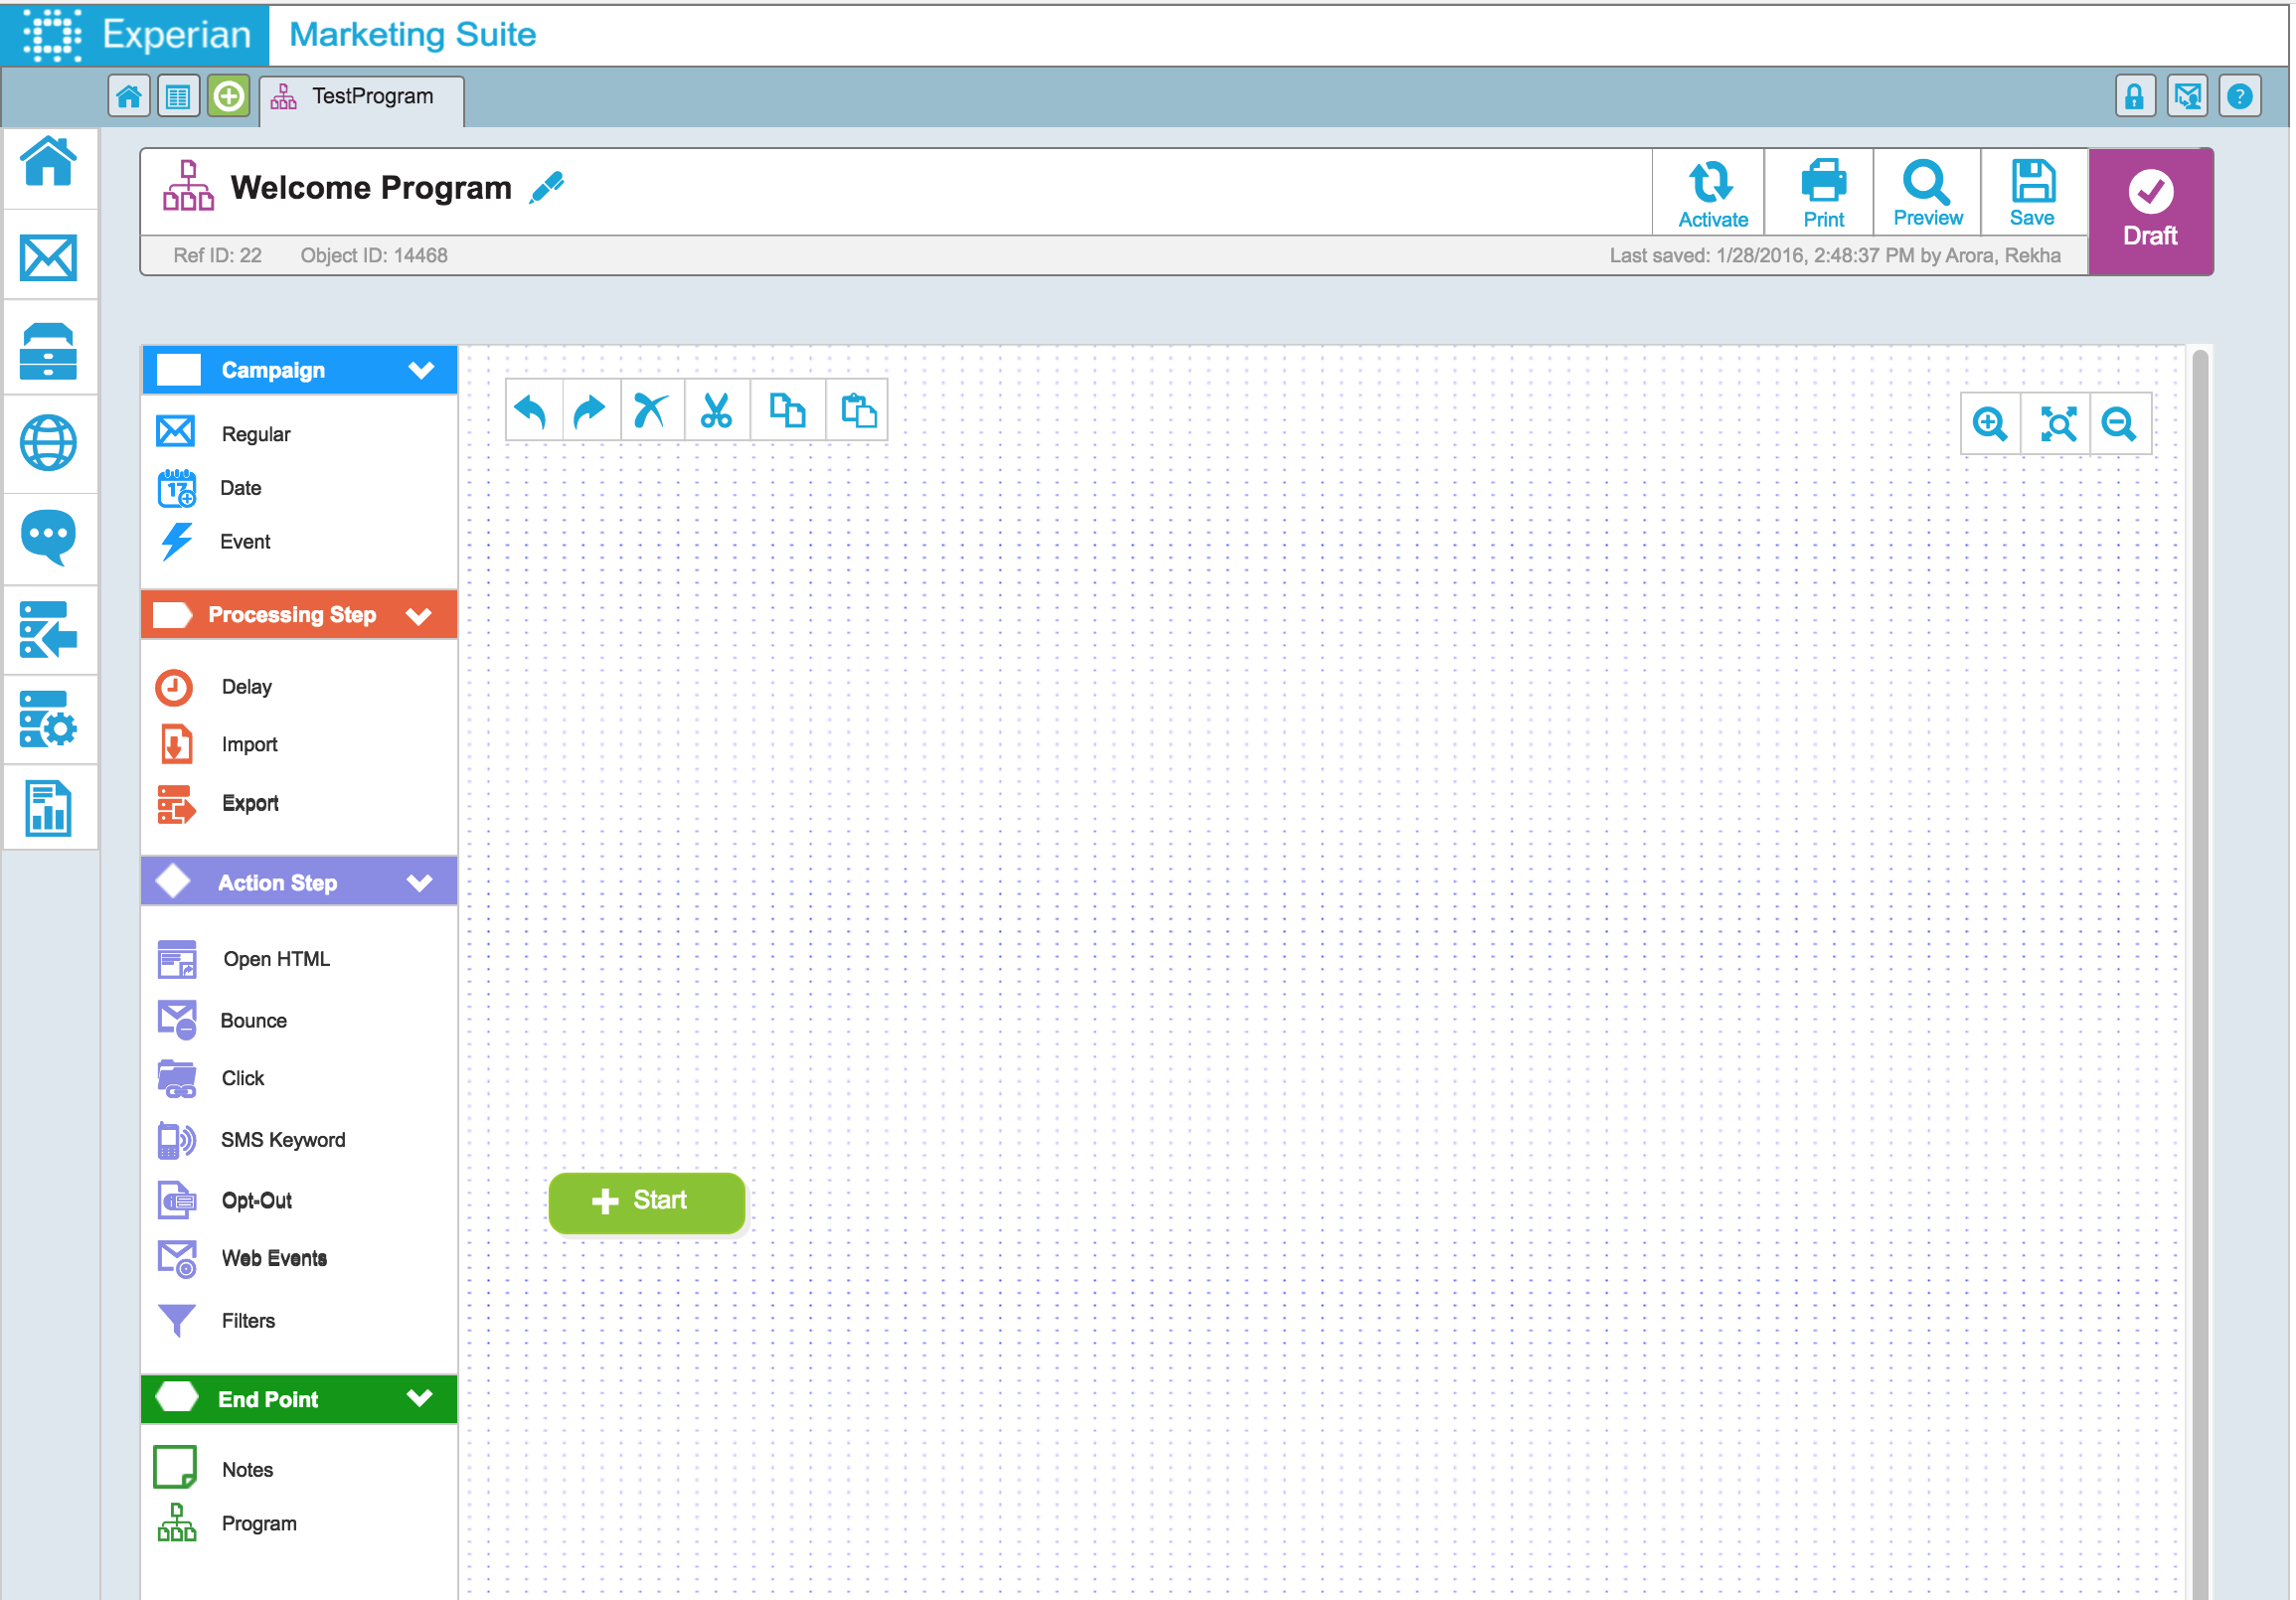
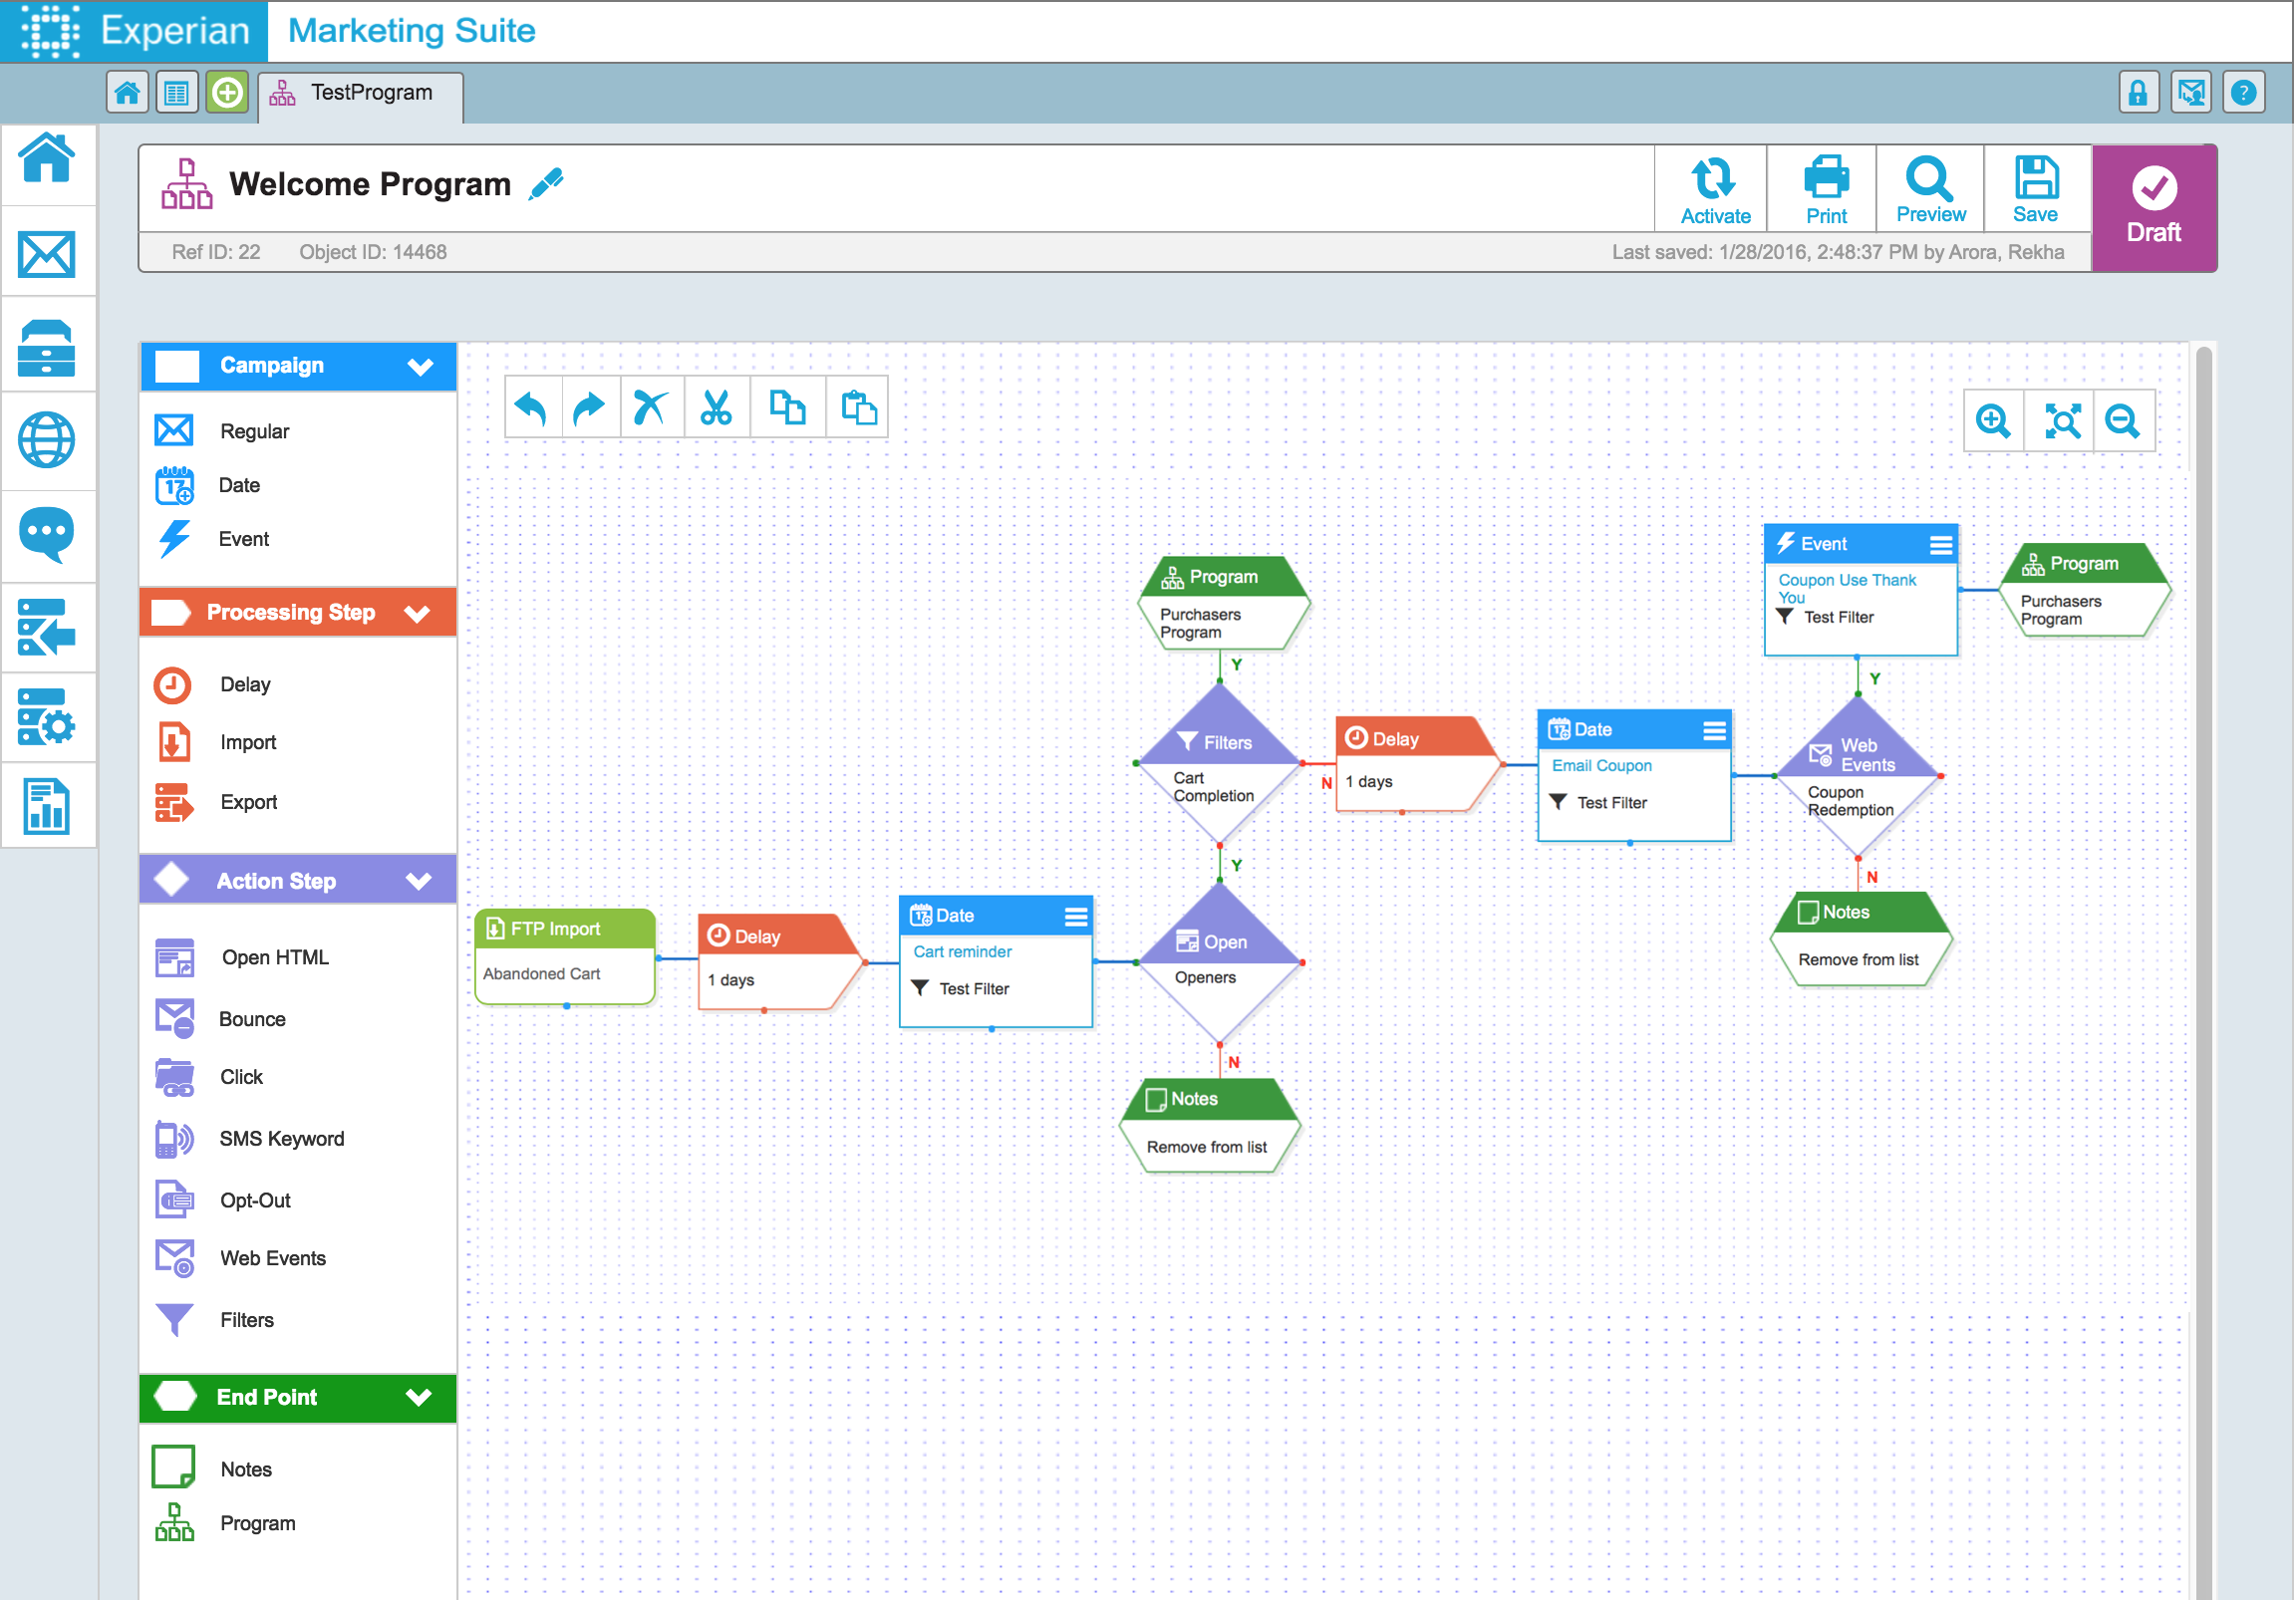
I did competitive research and designed Program Builder which helps user map the journey of their campaign. Championed Usability Lab in Vegas at our annual summit and worked with 20+ clients to test our new and upcoming product features. I analyzed hours of videos and post test questionnaires from the lab and applied the changes to the prototype.
Program Builder prototype link
I conducted usability lunch and learn series to educate the 80+ team members on Usability and Why usability is important and the intersection of human psychology with usability.
UX Lunch and Learn Presentation
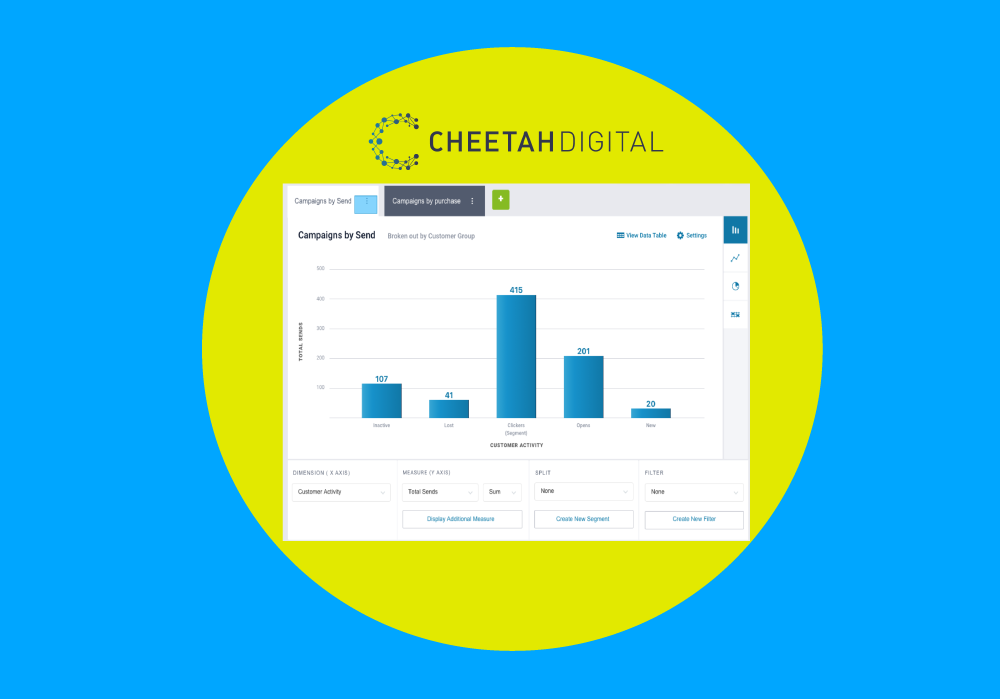
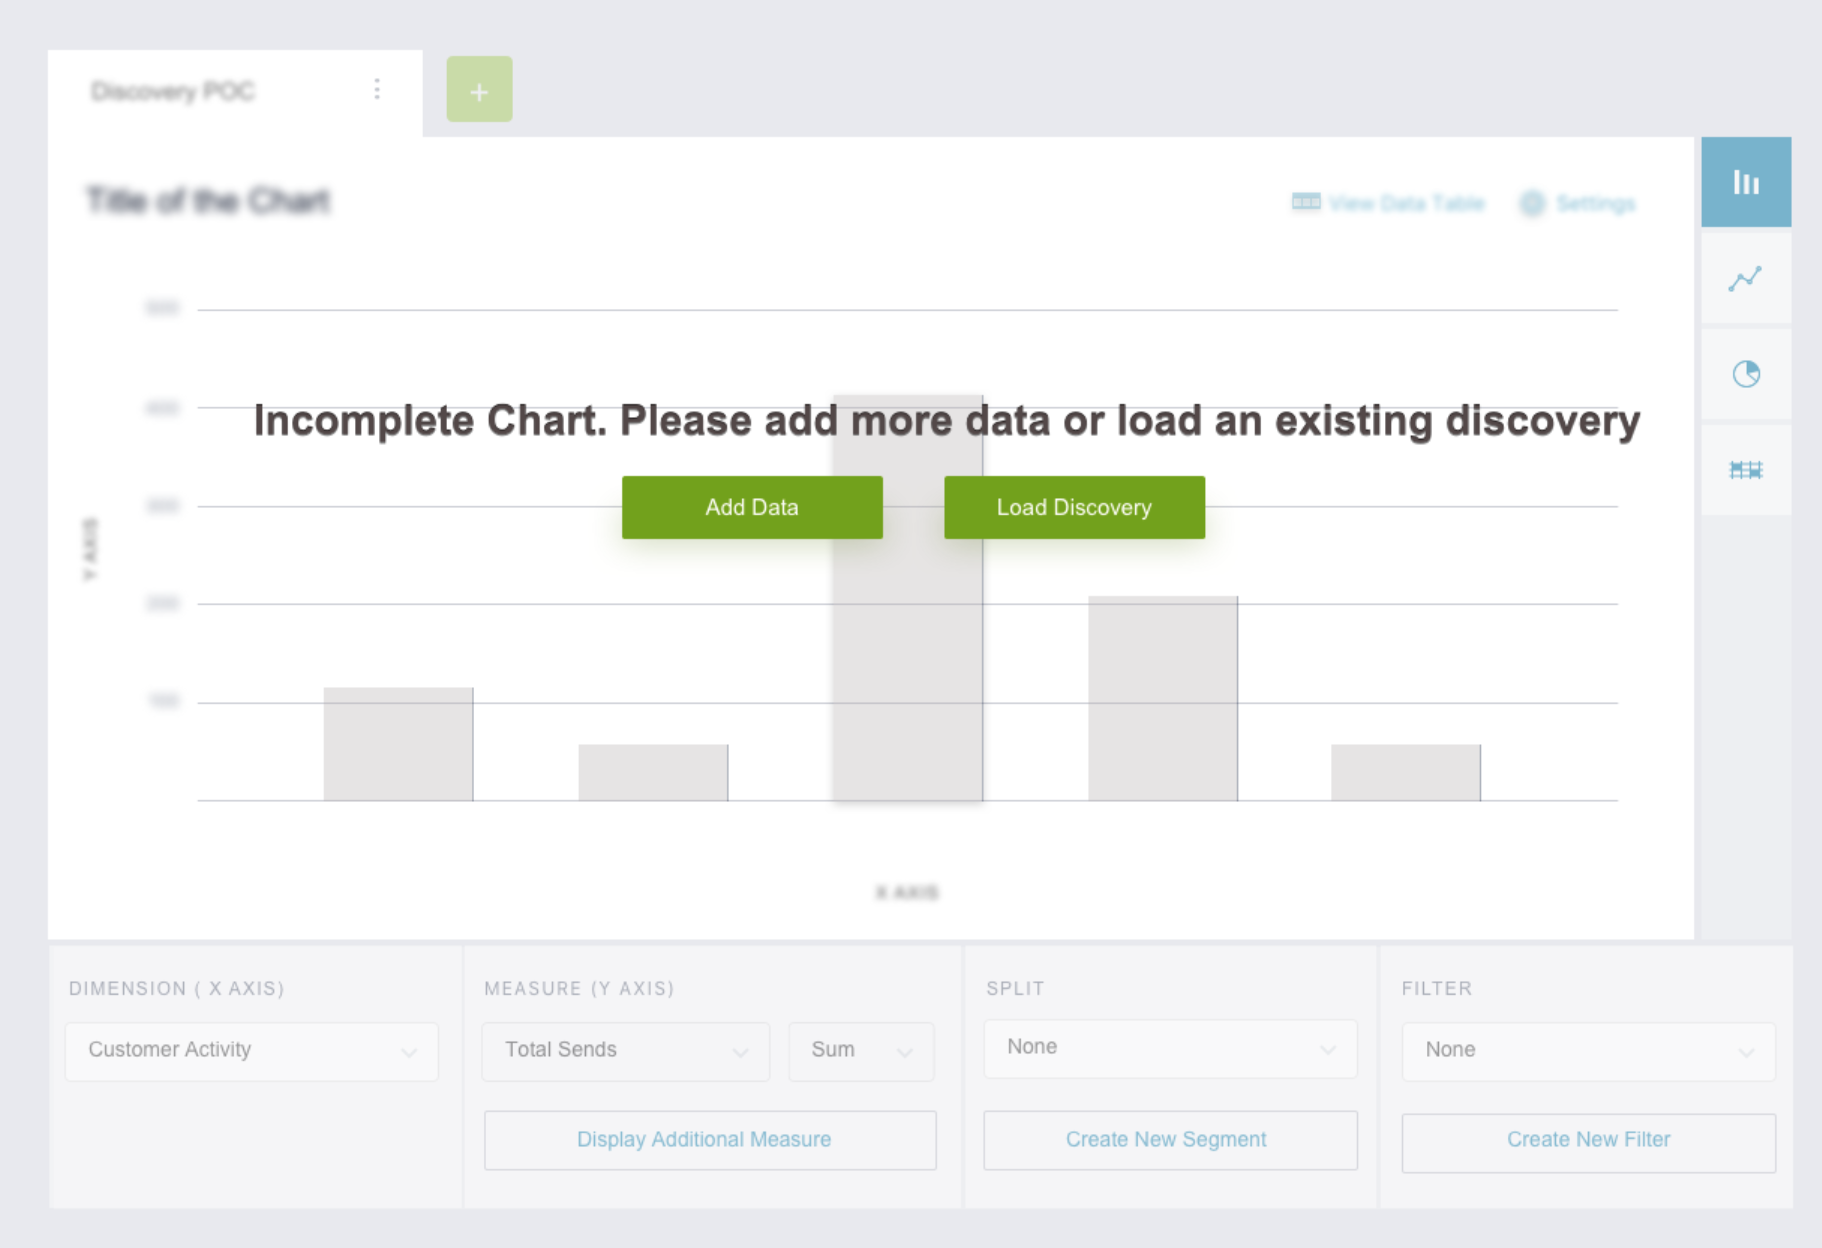
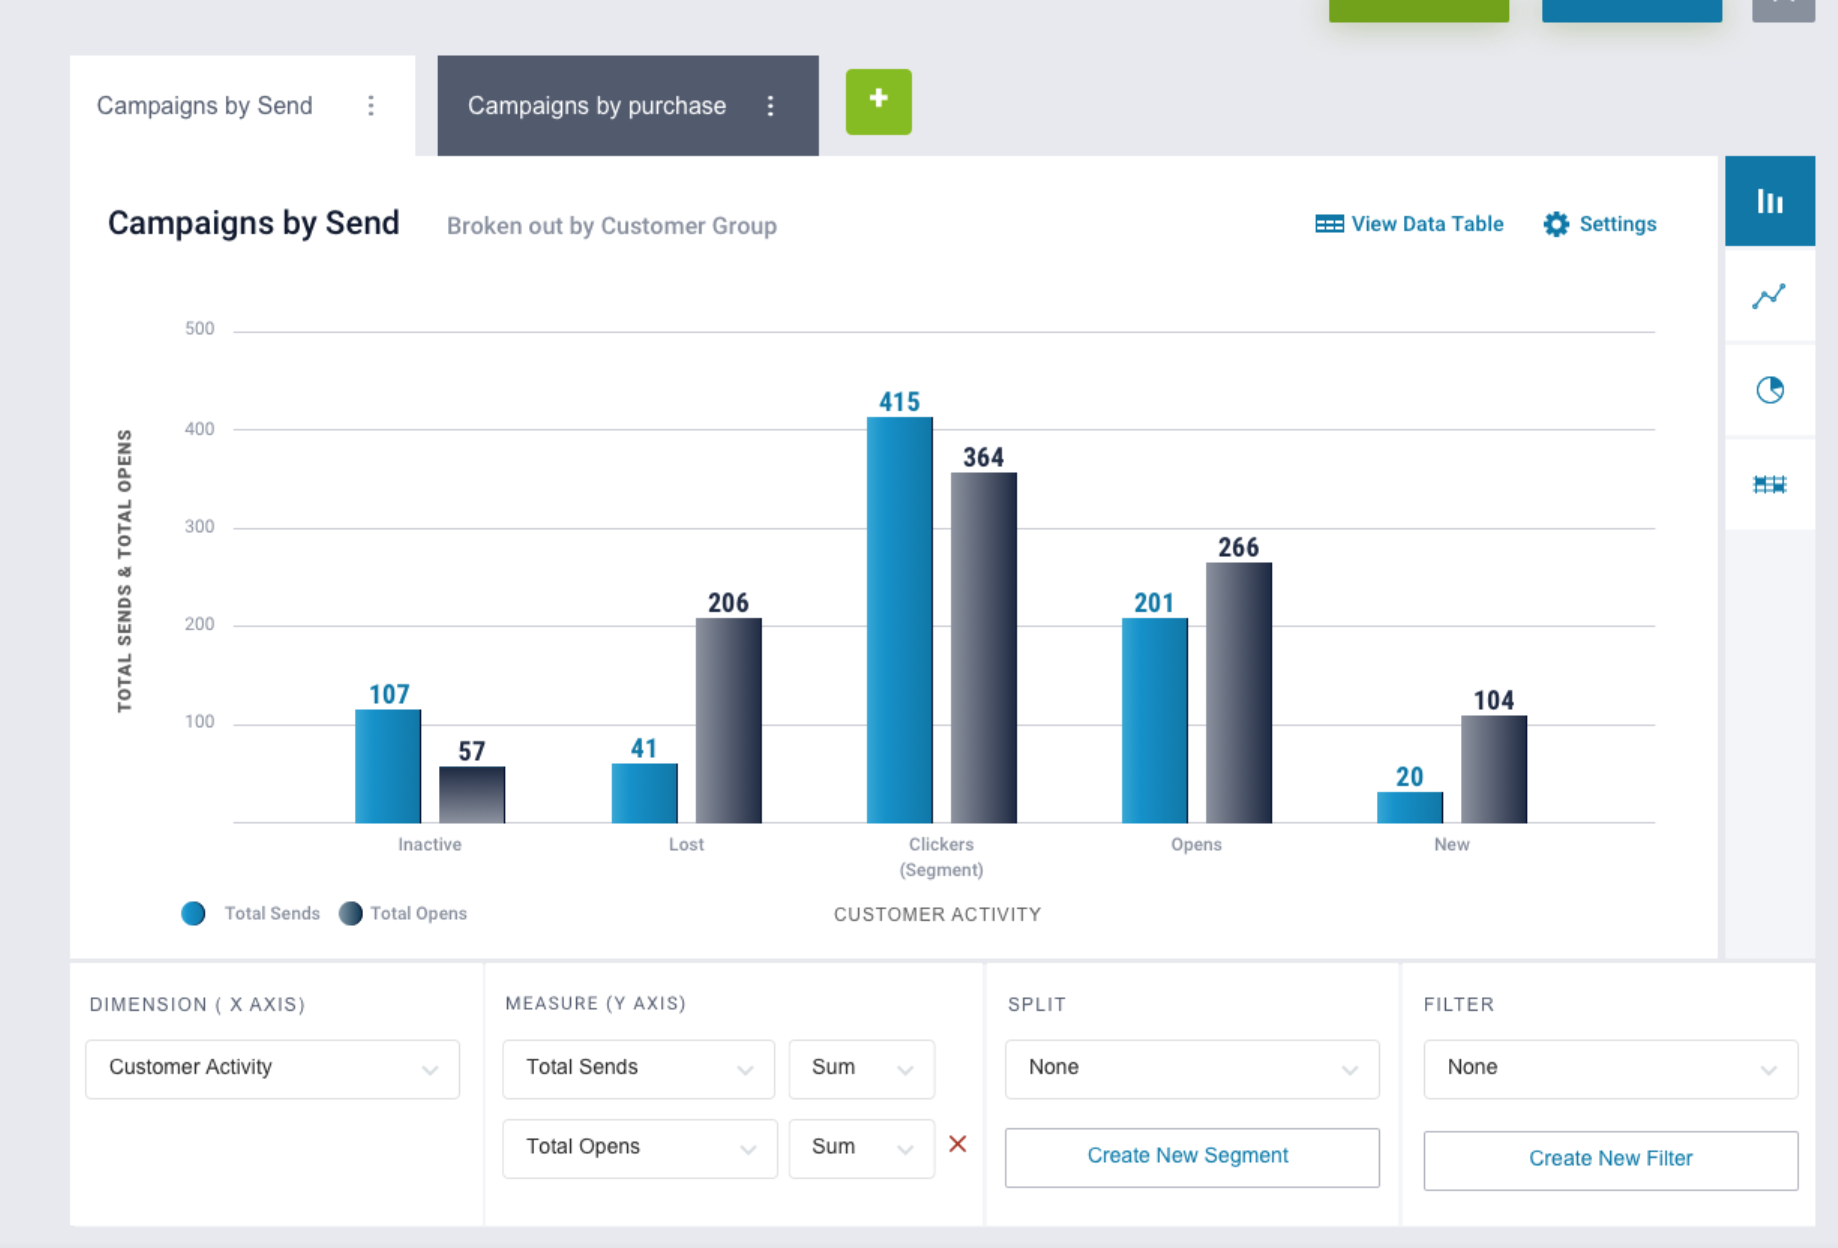
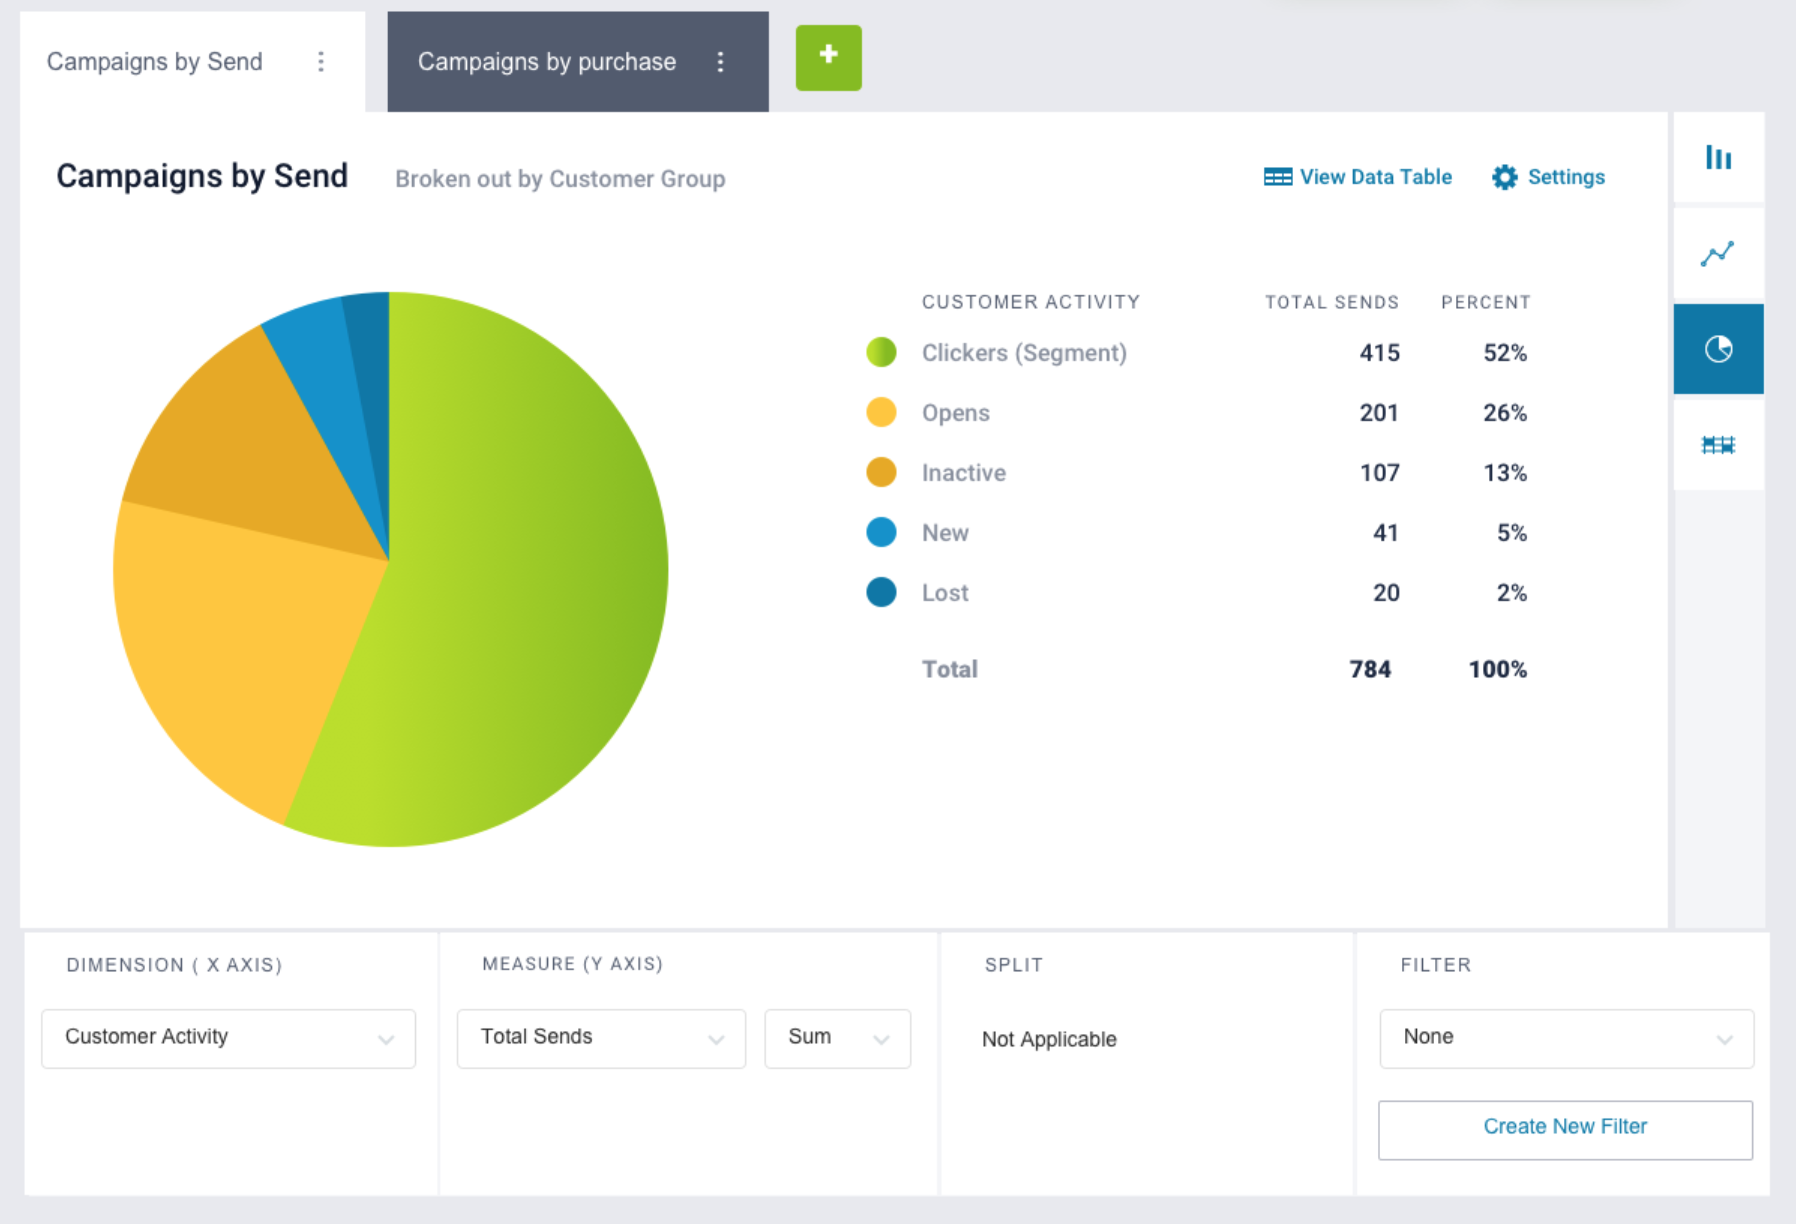
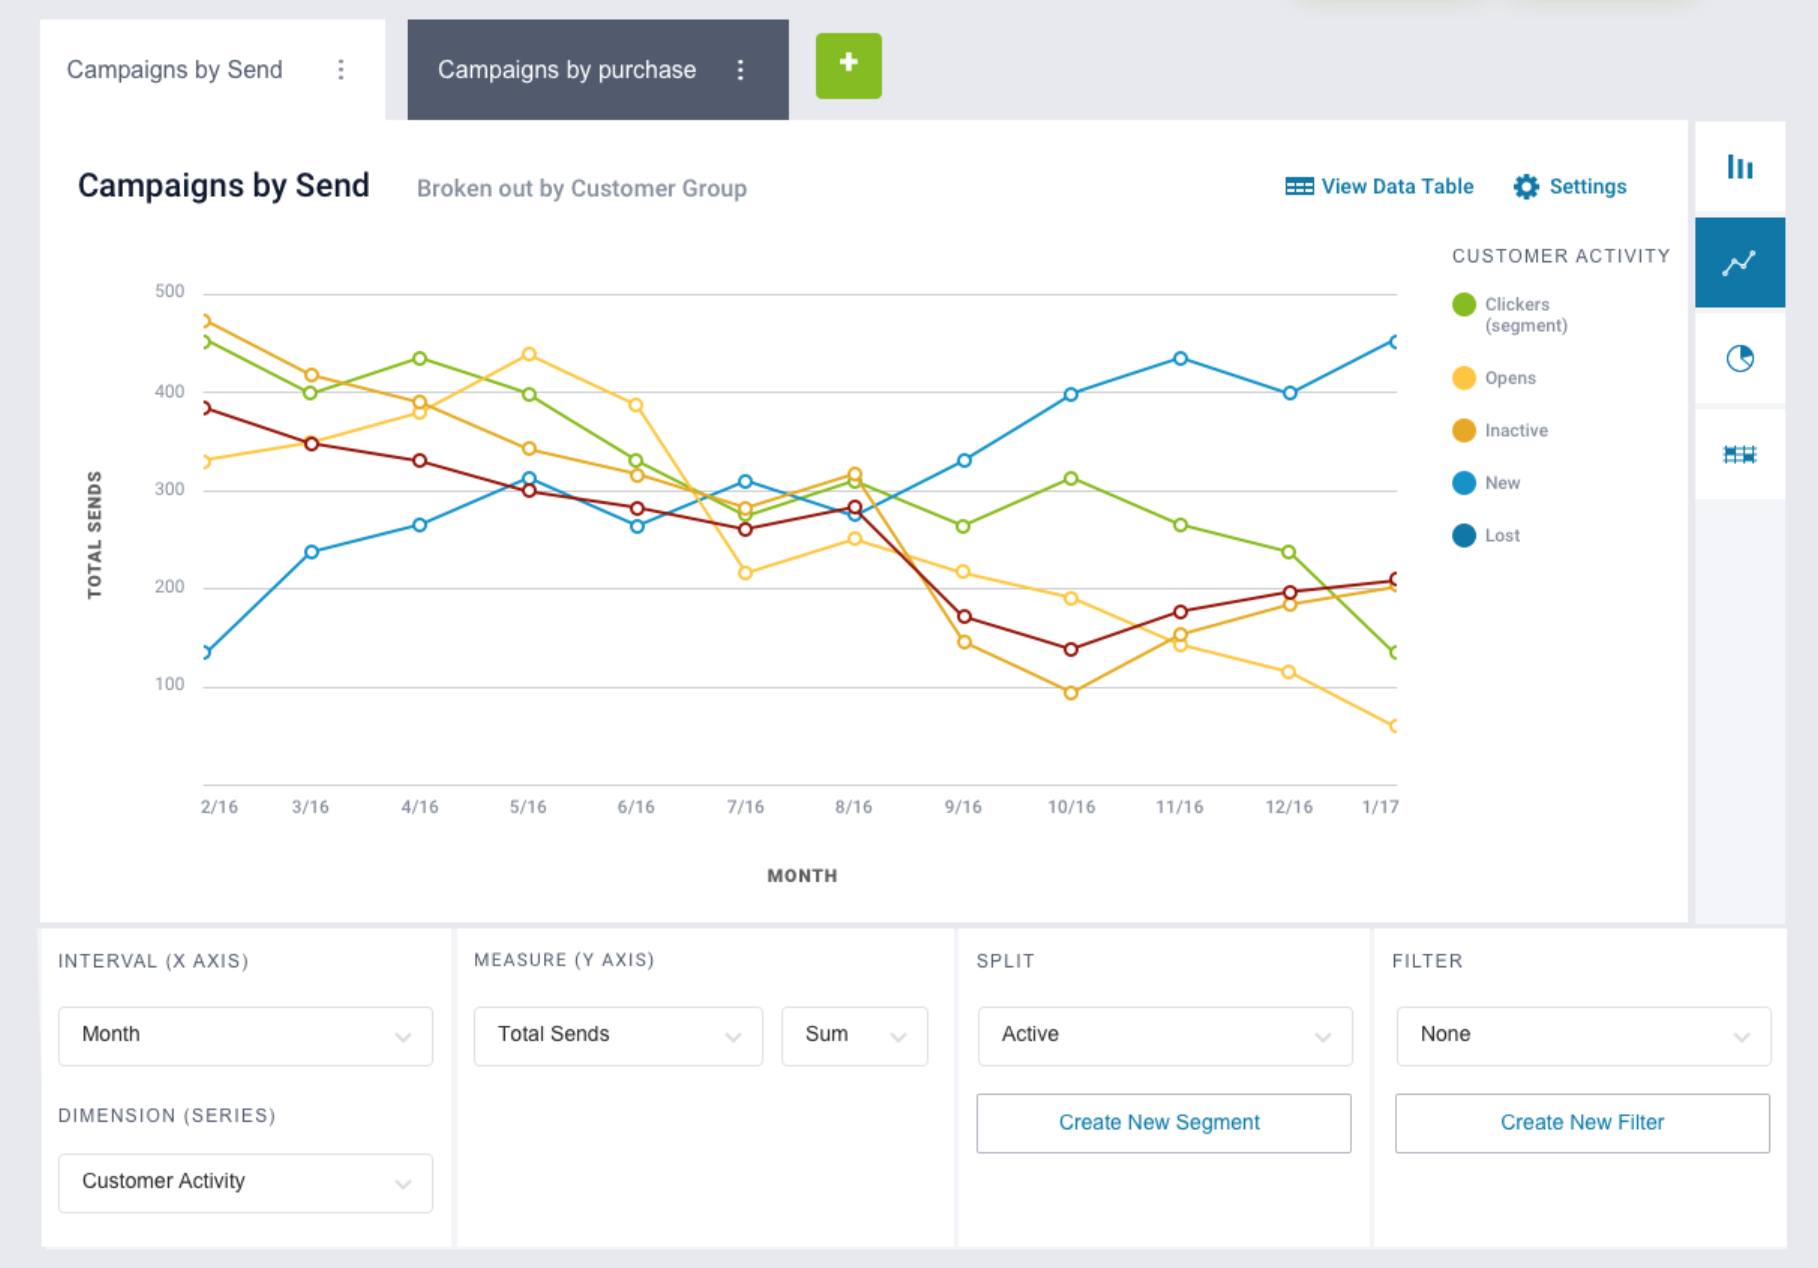
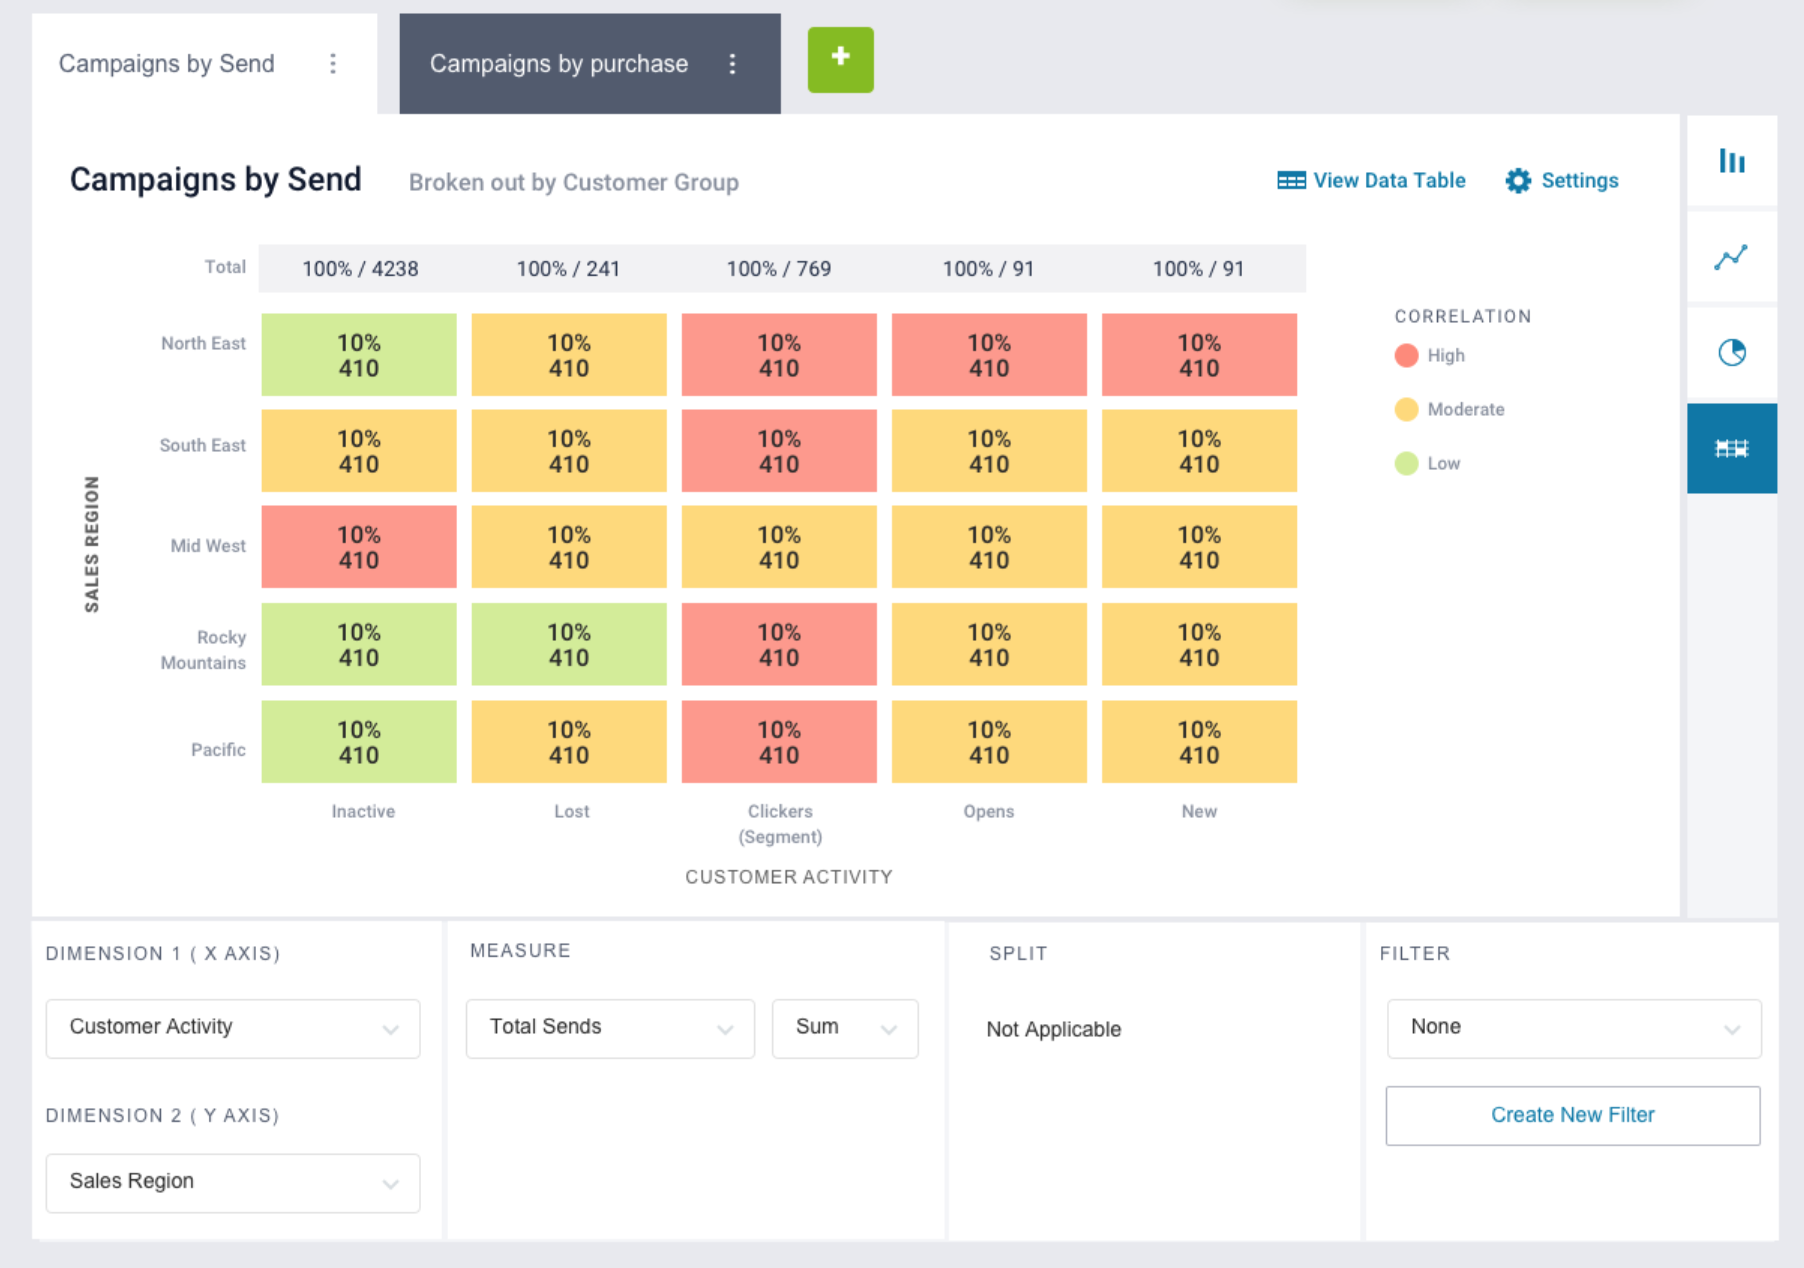
Data discovery is currently amongst the hottest BI trends. As data is becoming increasingly complex, users require flexible functions to be able to efficiently access and prepare their data for analysis. My goal was to design a data discovery tool which will give users capability to extract data,load data and in view it in graphical format.
We started by designing different personas who would use the Discovery Data tool. We came up with 4 different personas with different needs. The challenge was to design a solution which meets the needs of all the personas. We did sketching, white-boarding and discussions to arrive to a solution which will help users to visualize their data. We came with 4 different kind of data visualization graphs - bar chart, pie chart, line chart and heatmap. We used Sketch to create the designs and Invision to integrate the designs into clickable prototype.
Data Discovery Prototype link